
DIAGNOSTIC POTENTIAL OF CT TEXTURE ANALYSIS FOR PANCREATIC CYSTIC LESIONS
Victoria Rendell*2, Adam Awe2,1, Bret Hanlon2, Nicholas Marka2, Meghan Lubner1, Emily R. Winslow2
1Department of Radiology, University of Wisconsin School of Medicine and Public Health, Madison, WI; 2Department of Surgery, University of Wisconsin School of Medicine and Public Health, Madison, WI
Background: Accurate preoperative diagnosis of pancreatic cysts is challenging. Radiomic tools like texture analysis used to evaluate lesion heterogeneity hold promise for improved diagnostic accuracy, but have not been widely studied in pancreatic cysts. We aimed to identify texture features associated with mucinous cysts and the presence high grade dysplasia (HGD) or malignancy.
Methods: Surgical and pathology records at our institution from 1995-2017 were queried for resected non-pseudocyst pancreatic cysts. Texture analysis of cysts identified on contrast-enhanced computed tomography (CT) within 1 year prior to resection was performed using HealthMyne, a novel lesion analytic software. Volumetric segmentation was performed to obtain 5 first order (pixel histogram parameters) and 13 second order Grey-Level Co-Occurrence Matrix texture features. Bivariate logistic regression identified texture features associated with mucinous cysts and HGD/malignancy. A stepwise selection model identified predictive texture features in a training set (stratified random sample of 2/3 of cysts), and performance was assessed in the remaining test set. A stepwise model for mucinous cysts identified texture features predictive of HGD/malignancy.
Results: A total of 77 resected pancreatic cysts were included with characteristics outlined in Table 1. Of the mucinous cysts where the pathology report commented on grade of dysplasia (n=46), 17 (37%) had associated high grade dysplasia or invasive malignancy. On univariate analysis, two first order features (skewness and mean gray level intensity) were significantly correlated with a mucinous (vs non-mucinous) pathology, while no second order texture features were significantly correlated. The average skewness for mucinous cysts was 0.46±0.78 vs -0.004±0.43 for non-mucinous cysts, and the average mean for mucinous cysts was 32±18 Hounsfield units (HU) vs 47±23 HU for non-mucinous cysts (p=0.02 and <0.01, respectively). The stepwise regression model found skewness alone to be significantly predictive of mucinous cysts in the training set (Odds Ratio (OR) 14.3, 95% CI 1.7-118, AUC 0.77), and the model demonstrated overall accuracy of 76%, sensitivity of 95% and specificity of 17% in the test set. For mucinous cysts with HGD/malignancy vs not, univariate analysis found the first order feature mean gray level intensity to be significant (43±22 HU vs 27±15 HU). Mean remained significant in the stepwise model (OR 1.04, 95% CI 1.0-1.1) with accuracy of 71%, sensitivity of 35% and specificity of 93% (AUC 0.72) (Figure 1).
Conclusions: Two first order texture features identified mucinous cysts and the presence of HGD/malignancy with good accuracy. Textural analysis of pancreatic cysts may provide a non-invasive means of differentiation of mucinous cysts from non-mucinous ones. This promising area of radiomics deserves further study.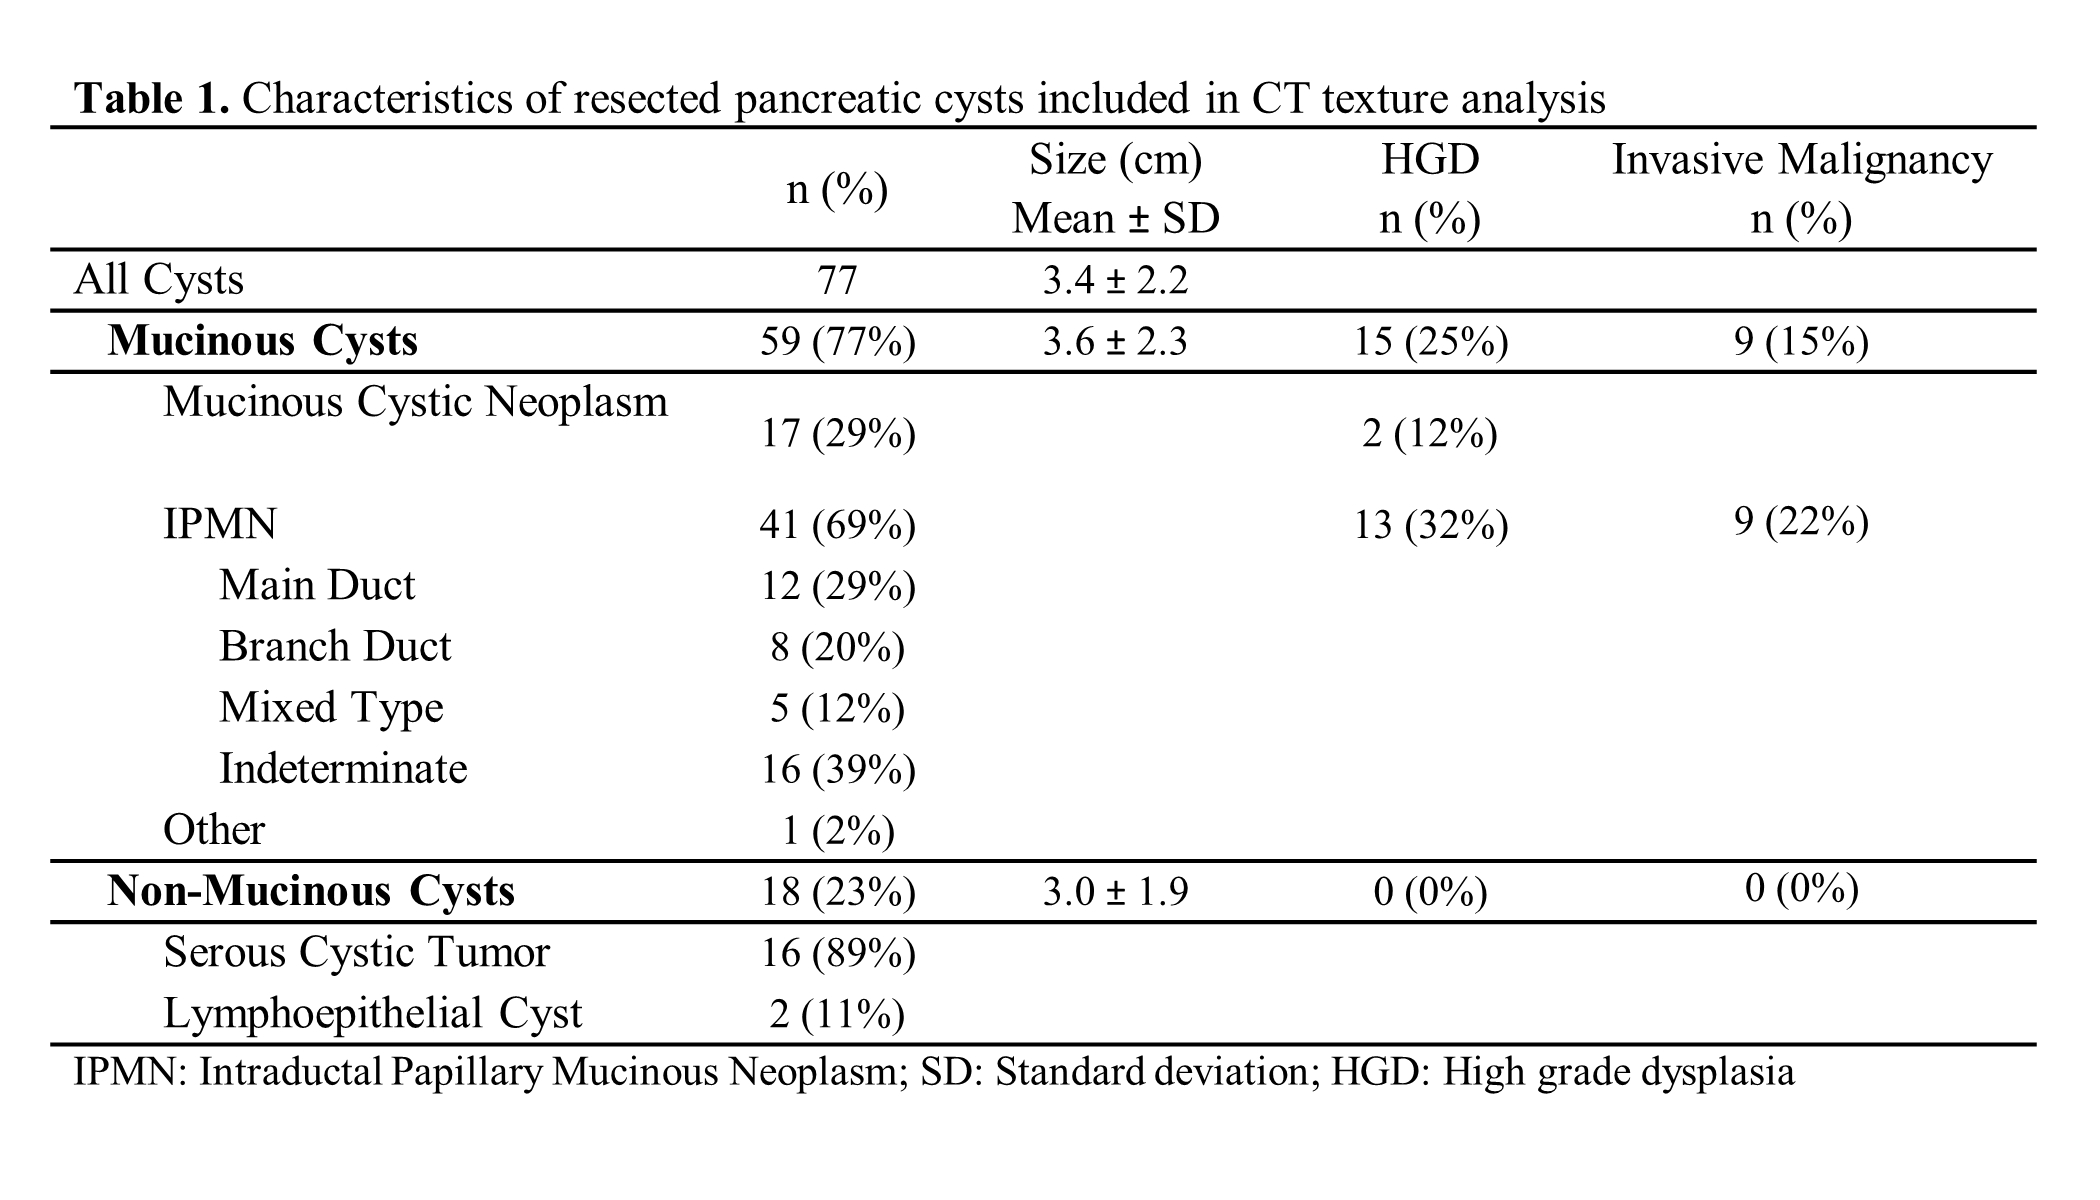
Table 1.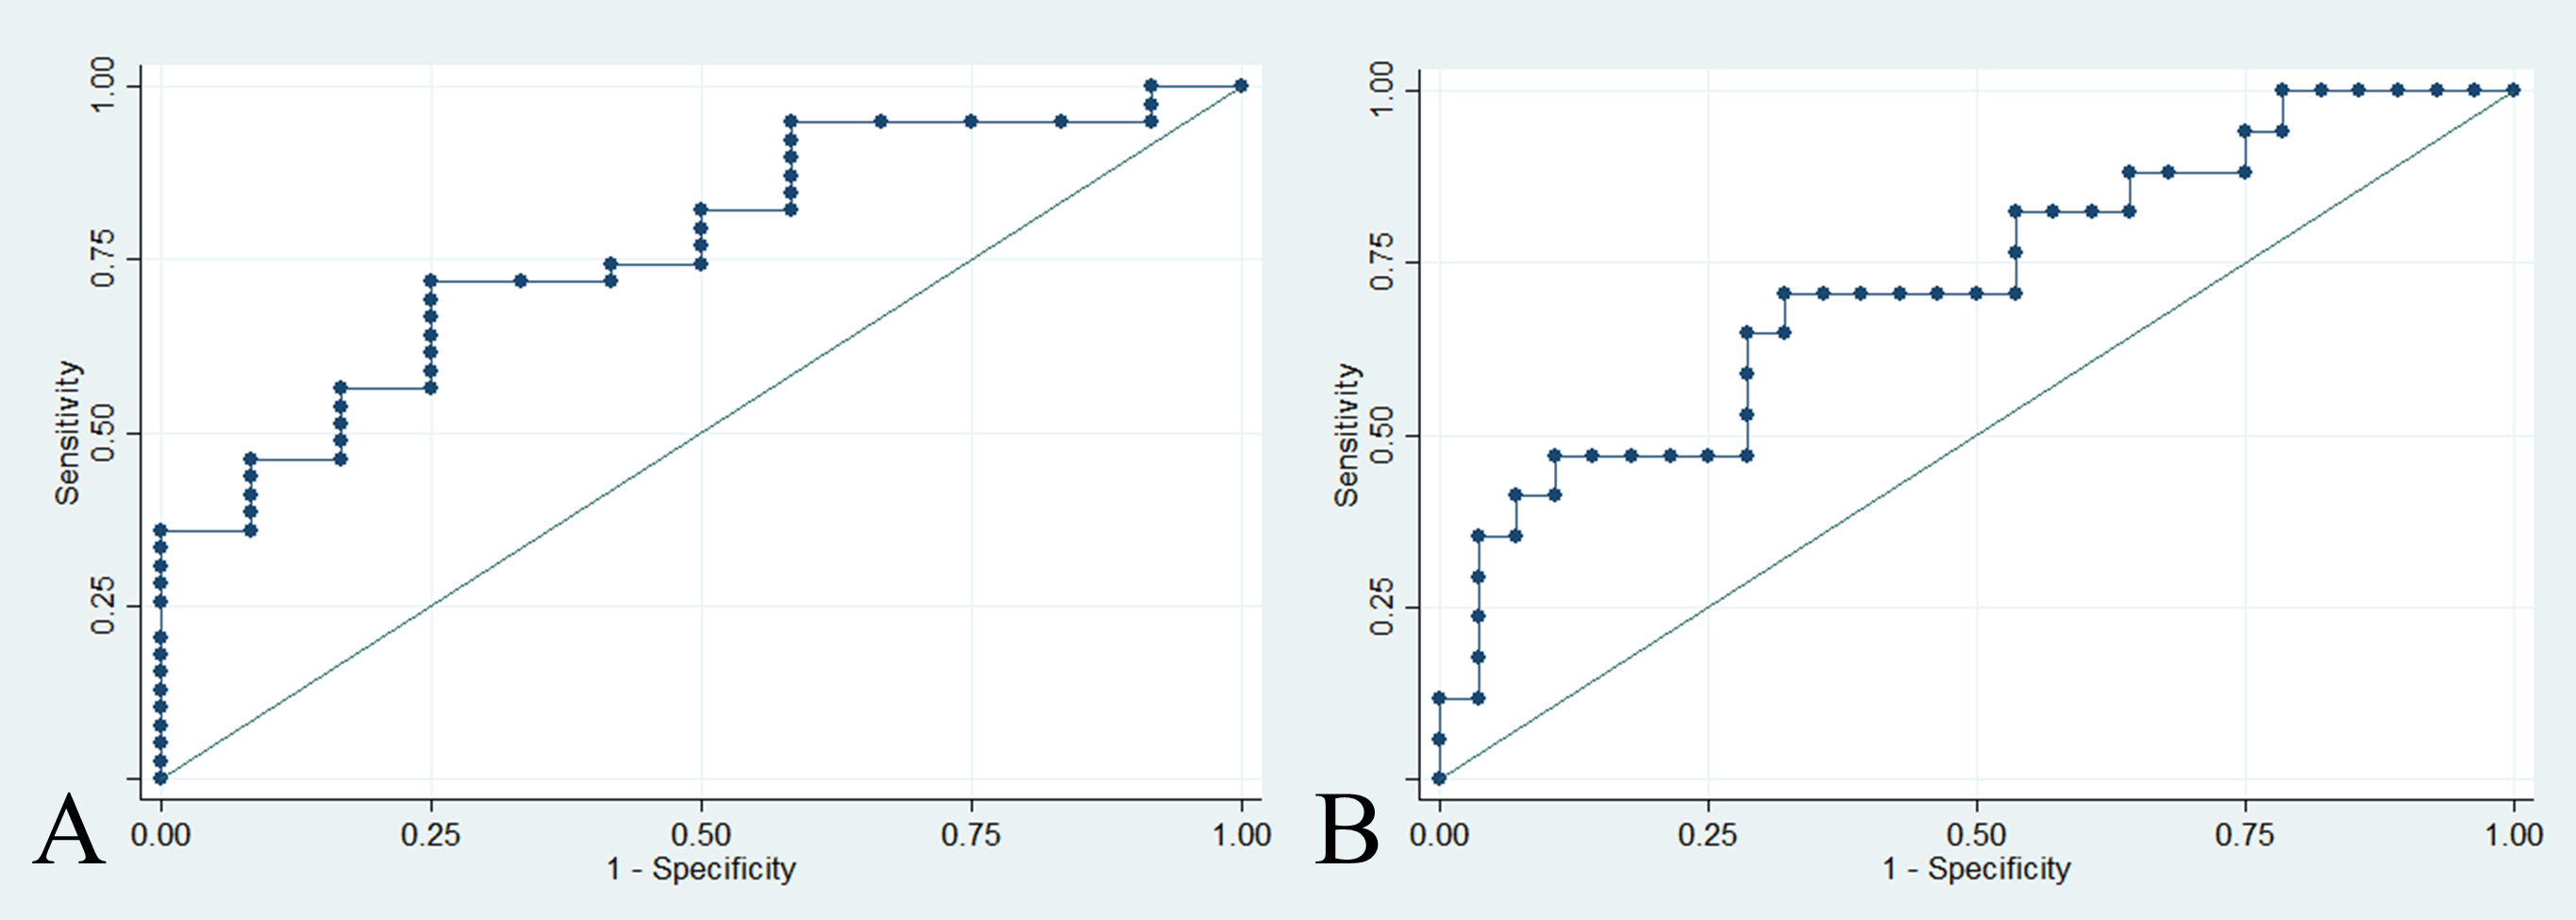
Figure 1. Receiver operating characteristic (ROC) curves demonstrating differentiation of pathologically-confirmed mucinous cysts and mucinous cysts with or without high grade dysplasia (HGD) or malignancy using quantitative first order CT imaging texture characteristics. (A) A stepwise selection model identified the first order texture feature skewness differentiated mucinous from non-mucinous cysts in the training set with an area under the curve (AUC) of 0.77 (σ =0.05). (B) A stepwise model identified the first order texture feature mean identified the presence of HGD or malignancy in mucinous cysts with AUC of 0.72 (σ =0.05).
Back to 2019 Posters


