CLINICAL AND PROGNOSTIC SIGNIFICANCE OF PREOPERATIVE PROTHROMBIN TIME IN CHOLANGIOCARCINOMA PATIENTS FOLLOWING SURGICAL RESECTION
Huishan Wang*1,2, Xianxiu Ge2, Lin Miao2
1Nanjing Medical University, Nanjing, China; 2The Second Affiliated Hospital of Nanjing Medical University, Nanjing, China
Background: Prothrombin time (PT) can predict survival in several types of malignancies. This study aims to investigate the predictive values of PT levels in patients with cholangiocarcinoma (CCA).
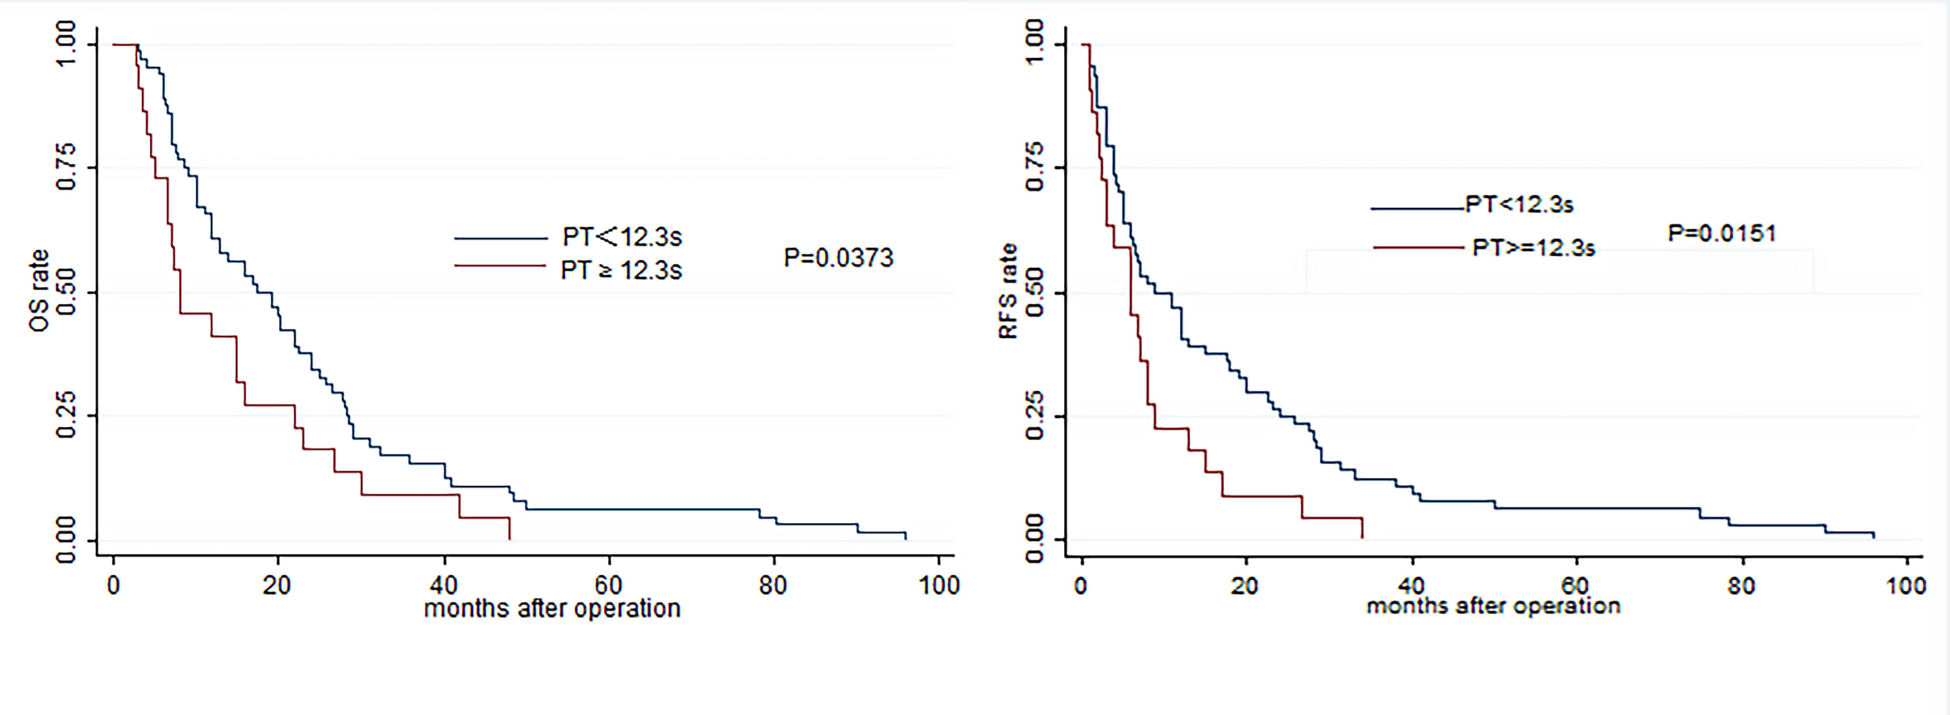
Methods: We retrospectively analyzed the PT from 86 CCA subjects who underwent curative resection in our hospital from December 2008 to August 2017. The relationship between PT and survival times was analyzed through univariate and multivariate analyses (Cox proportional hazards model). Kaplan-Meier curves and log-rank test were used to assess the effects of PT on overall survival (OS) and tumor recurrence-free survival (RFS).
Results: Increased PT levels remained as highly significant predictors in OS (P = 0.021; hazard ratio (HR), 1.799) and RFS (P = 0.016; HR, 1.871), independent of age, tumor differentiation and TNM stage. In the low PT level group (PT < 12.3 s), patients showed a higher mean OS (23.03 m vs.14.38 m, P = 0.0250) and RFS (17.78 m vs. 8.30 m, P = 0.0511) than those with high PT levels (PT ≥ 12.3 s). A highly significant association was observed between high PT level and shortened OS (P = 0.0373) and worse RFS (P = 0.0151).
Conclusion: Preoperative increase in PT can serve as a simple but effective predictor of poor survival in CCA patients who undergo curative surgeries.
Univariate and multivariate analyses of relationship between various clinical factors and overall survival(OS) or recurrence free survival (RFS).
| Variable | Category | Univariate analysis, OS | Multivariate analysis, OS | Univariate analysis, RFS | Multivariate analysis, RFS | ||||||||
| HR | P | 95%CI | HR | P | 95%CI | HR | P | 95%CI | HR | P | 95%CI | ||
| Gender | M/F | 0.747 | 0.194 | 0.481-1.160 | 0.786 | 0.278 | 0.508-1.215 | ||||||
| Age | <64/≥64 | 1.709 | 0.017 | 1.102-2.652 | 1.430 | 0.124 | 0.921-2.335 | 1.650 | 0.023 | 1.071-2,542 | 1.341 | 0.209 | 0.849-2.118 |
| PLT, 10^9/L | <258.67/≥258.67 | 0.652 | 0.090 | 0.397-1.069 | 0.677 | 0.124 | 0.413-1.112 | ||||||
| APTT, s | <30.8/≥30.8 | 0.868 | 0.577 | 0.529-1.426 | 0.950 | 0.838 | 0.578-1.559 | ||||||
| PT, s | <12.3/≥12.3 | 1.67 | 0.041 | 1.020-2.733 | 1.799 | 0.021 | 1.091-2.965 | 1.827 | 0.019 | 1.105-3.018 | 1.871 | 0.016 | 1.121-3.123 |
| INR | <1.07/≥1.07 | 1.67 | 0.041 | 1.020-2.733 | 1.799 | 0.021 | 1.091-2.965 | 1.827 | 0.019 | 1.105-3.018 | 1.871 | 0.016 | 1.121-3.123 |
| FIB, g/L | <4.49/≥4.49 | 1.393 | 0.196 | 0.843-2.304 | 1.240 | 0.397 | 0.753-2.04 | ||||||
| TT, s | <18.75/≥18.75 | 0.853 | 0.528 | 0.519-1.399 | 0.800 | 0.379 | 0.753-2.04 | ||||||
| DD, ug/ml | <1.11/≥1.11 | 1.263 | 0.341 | 0.781-2.043 | 1.410 | 0.162 | 0.871-2.285 | ||||||
| Differentiation | Middle-High/Low | 3.382 | 0.000 | 2.033-5.628 | 2.993 | 0.000 | 1.770-5.061 | 3.384 | 0.000 | 2.021-5.667 | 3.163 | 0.000 | 1.858-5.388 |
| Lymph | +/- | 0.712 | 0.127 | 0.459-1.102 | 0.690 | 0.094 | 0.447-1.064 | ||||||
| Nerve | +/- | 0.756 | 0.240 | 0.475-1.205 | 0.692 | 0.124 | 0.433-1.107 | ||||||
| Stage | I-II/III-IVA | 1.840 | 0.015 | 1.126-3.008 | 1.621 | 0.062 | 0.977-2.692 | 2.154 | 0.003 | 1.295-3.583 | 2.048 | 0.008 | 1.207-3.477 |

Back to 2019 Posters


