
MORTALITY OF ESOPHAGEAL CANCER IN BRAZIL: GEOGRAPHIC AND TEMPORAL ANALYSIS OF THE LAST 17 YEARS
Daniel Navarini*1,2,3, Victor A. Kuiava2, Paulo R. Reichert2,4, Carlos A. Madalosso1, Richard R. Gurski3,5
1Gastric Surgery, Gastrobese Clinic, Passo Fundo, RS, Brazil; 2Medicine College, University of Passo Fundo, Passo Fundo, Passo Fundo, Rio Grande do Sul, Brazil; 3Medicine College, Federal University of Rio Grande do Sul, Passo Fundo, Rio Grande do Sul, Brazil; 4Department of Digestive Surgery, Hospital São Vicente de Paulo, Passo, Passo Fundo, Rio Grande do Sul, Brazil; 5Department of Digestive Surgery, Hospital de Clínicas de Porto Alegre, Porto Alegre, Rio Grande do Sul, Brazil
Introduction: Esophageal cancer (EC) is the eighth neoplasia in incidence and the sixth in mortality due to malignant neoplasm in the world. In Brazil, it corresponds to the eleventh most common cancer in male and the thirteenth in female. The objective of this study was to demonstrate the epidemiological variations of mortality due to the disease in the Brazilian states and municipalities.
Methodology: Retrospective and temporal aggregate study, with exploratory and quantitative documentary approach. Data were collected from the Mortality Information System available at the Department of Informatics of the Unified Health System in a period of 17 years (2000 to 2016). Population demographic data for each year, age group and gender were obtained through the Brazilian Institute of Geography and Statistics. These database are the oficial data form brazil's governament. The variants observed were the esophageal malignancy death (ICD-10, C15), analyzed in the 27 Brazilian states and the Federal District - a division recommended by the Brazilian Institute of Geography of Statistics. The analysis was carried out in the five administrative regions of Brazil - South, Southeast, Midwest, North and Northeast. The data analyzed were divided into years of death, gender and age groups (0-9, 10-19, 20-29, 30-39, 40-49, 50-59, 60-69, 70-79, 80+ years). The mortality rates were calculated by the correlation between each variable with its category - the mortality rates were standardized by age, data were presented in calculations for 100,000 women or men.
Results: During the analyzed period, there were 119,379 deaths due to esophageal cancer. The mortality rate for men was 6.08 (95% CI, 5.83-6.33) and 1.73 (95% CI, 1.66-1.8) for 100,000 men and women. The proportion of men and women was 3.5: 1. There was a significant increase (p<0.05) between 2000 and 2016 in mortality in four of the regions, except in the South. The Northeast region presented an increase of 160% (p<0.0001) between 2000 and 2016. The state with the highest mortality rate was Rio Grande do Sul (Table 1), with rates of 13.9 (95% CI, 13.67-14.15) for males and 4.5 (95% CI, 4.46-4.68) for females. When mortality patterns were analyzed, the highest indices occurred in the southern half of Brazil for both men and women (Figure 1)
Discussion: The epidemiology of EC is variable all over the world, presenting pockets of high incidence and mortality - located in Asia. The EC is one of the tumors that has grown the most in recent years around the world, and the data found by the study corroborate with this perspective.
Conclusion: The Brazilian scenario for esophageal neoplasia presents a significant increase in mortality in the analyzed period and there is significant diversity between states and cities.
Table 1 - Comparison between mortality by locality and population between 2000 and 2016.
| Federal Unity | 2000 | 2016 | ||||
| Death | Population | Mortality (per 100,000) | Death | Population | Mortality (per 100,000) | |
| Brazil | 5,306 | 173,448,354 | 3.06 | 8,273 | 205,557,576 | 4.02 |
| Rio Grande do Sul | 876 | 10,266,748 | 8.53 | 946 | 11,286,500 | 8.38 |
| Santa Catarina | 223 | 5,453,900 | 4.09 | 341 | 6,910,553 | 4.93 |
| Paraná | 535 | 9,665,570 | 5.54 | 639 | 11,242,720 | 5.68 |
| São Paulo | 1,417 | 37,799,568 | 3.75 | 1,798 | 44,749,699 | 4.02 |
| Rio de Janeiro | 562 | 14,802,360 | 3.80 | 632 | 16,112,140 | 3.92 |
| Minas Gerais | 645 | 18,178,056 | 3.55 | 1,253 | 20,997,560 | 5.97 |
| Espírito Santo | 140 | 3,194,255 | 4.38 | 247 | 3,973,697 | 6.22 |
| Mato Grosso do Sul | 61 | 2,125,817 | 2.87 | 128 | 2,682,386 | 4.77 |
| Mato Grosso | 39 | 2,560,987 | 1.52 | 95 | 3,305,531 | 2.87 |
| Goiás | 109 | 5,075,597 | 2.15 | 229 | 6,695,855 | 3.42 |
| Distrito Federal | 49 | 2,108,798 | 2.32 | 72 | 2,977,216 | 2.42 |
| Acre | 3 | 577,931 | 0.52 | 8 | 816,687 | 0.98 |
| Rondônia | 21 | 1,401,537 | 1.50 | 36 | 1,787,279 | 2.01 |
| Amazonas | 23 | 2,882,001 | 0.80 | 49 | 4,001,667 | 1.22 |
| Roraima | 2 | 336,827 | 0.59 | 4 | 514,229 | 0.78 |
| Pará | 36 | 6,386,879 | 0.56 | 116 | 8,272,724 | 1.40 |
| Amapá | 4 | 499,585 | 0.80 | 9 | 782,295 | 1.15 |
| Tocantins | 7 | 1,186,154 | 0.59 | 22 | 1,532,902 | 1.44 |
| Maranhão | 15 | 5,794,908 | 0.26 | 79 | 6,954,036 | 1.14 |
| Piauí | 19 | 2,877,447 | 0.66 | 96 | 3,211,411 | 2.99 |
| Ceará | 130 | 7,601,788 | 1.71 | 376 | 8,964,432 | 4.19 |
| Rio Grande do Norte | 28 | 2,837,883 | 0.99 | 115 | 3,474,998 | 3.31 |
| Paraíba | 32 | 3,472,851 | 0.92 | 127 | 3,999,415 | 3.18 |
| Pernambuco | 109 | 8,119,695 | 1.34 | 285 | 9,410,772 | 3.03 |
| Alagoas | 32 | 2,897,878 | 1.10 | 62 | 3,358,527 | 1.85 |
| Sergipe | 13 | 1,824,045 | 0.71 | 39 | 2,265,779 | 1.72 |
| Bahia | 176 | 13,519,289 | 1.30 | 535 | 15,276,566 | 3.50 |
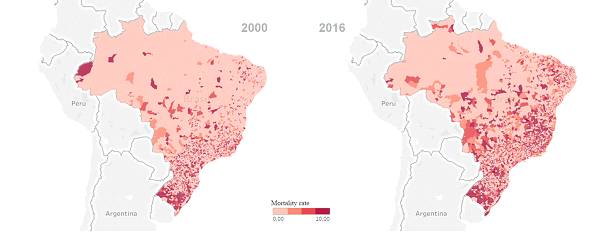
Figure 1: Comparison of the geographic distribution of esophageal cancer between 2000 and 2016 according to municipal mortalities per 100,000 inhabitants.
Back to 2019 Posters


