
THE IMPACT OF DELAYS TO DEFINITIVE SURGICAL CARE ON SURVIVAL IN COLORECTAL CANCER PATIENTS
Maude Trepanier*4, Tiffany Paradis2, Araz Kouyoumdjian2, Teodora Dumitra4, Patrick Charlebois1, Barry Stein1, A. Sender Liberman1, Franco Carli3, Gerald M. Fried4, Liane S. Feldman4, Lawrence Lee1
1Colorectal Surgery, McGill University Health Center, Montreal, QC, Canada; 2Faculty of Medicine, McGill University, Montreal, QC, Canada; 3Anesthesiology, McGill University Health Center, Montreal, QC, Canada; 4General Surgery, McGill University Health Center, Montreal, QC, Canada
Introduction: Prolonged delay to definitive treatment may have detrimental effects on cancer outcomes for many tumors. For colorectal cancer, current standards target 28 days from date of diagnosis to definitive treatment. Preoperative optimization through prehabilitation may improve postoperative outcomes, but the impact of longer delays on oncological outcomes remains poorly described. The objective of this study was to determine the effect of delays to curative-intent surgical resection on survival in colorectal cancer patients.
Methods: All adult patients undergoing elective curative-intent resection for biopsy-proven, primary stage 1-3 colorectal cancer from 01/2009-12/2014 at a single high-volume specialist referral centre were reviewed. In-situ disease and patients who received neoadjuvant therapy were excluded from the study. Treatment delays were defined as the time between tissue diagnosis and definitive surgery and grouped into <4 weeks, 4 to <8 weeks and ≥8 weeks. The primary outcomes were 5-year disease-free(DFS) and overall survival(OS). DFS and OS were analyzed using Kaplan-Meier curves and Cox regression models. Subgroup analysis for stage III disease was performed.
Results: A total of 408 patients were included(82.8% colon, 17.2% rectal), with a mean interval from tissue diagnosis to surgery of 56.0 days(SD 28.0). There were 14.0% of patients that underwent resection <4 weeks, 40.0% at 4 to <8 weeks and 46.1% ≥8 weeks. Age and gender were similar, but patients in the <4 and ≥8 weeks groups had more comorbidities (40.4% and 43.1% vs. 27.3% of 4 to <8 weeks, p<0.001). Tumor characteristics, including pTNM stage, were well-balanced. However, more rectal cancer patients had treatment delay ≥8 weeks compared to patients with colonic tumors(68.6% vs. 41.3%, p<0.001). A comparable proportion of patients received adjuvant systemic therapy (77.3% <4 weeks vs. 75.9% 4 to <8 weeks vs. 77.1% ≥8 weeks, p=0.987 for stage 3 disease) and time to adjuvant therapy did not differ between groups(p=0.379). Median follow-up duration was 58.4 months(SD29.9). There were no differences in cumulative 5-year DFS and OS between the three groups(Figure). After adjusting for confounders, surgical delays were not independently associated with DFS and OS(Table). Older age and higher TNM stages predicted worse DFS and OS in all regression models. Laparoscopic approach and receipt of adjuvant systemic chemotherapy were independently associated with improved survival. Subgroup analysis reported similar results for patients with stage 3 disease.
Conclusion: In this study, delays longer than 28 days from time of colorectal cancer diagnosis to surgery were not associated with worse oncologic outcomes, even in stage 3 disease. Delaying surgery by a few weeks to optimize patients through prehabilitation can be considered without concern about negatively impacting survival.
Table 1 - Multivariate regression models for 5-year DFS and OS
| Variables | Disease-free survival HR (95%CI) | Overall survival HR (95% CI) |
| Delay to surgery <4 weeks 4 to <8 weeks ≥ 8 weeks | - ref 1.03 (0.50-2.11) 0.90 (0.44-1.85) | - ref 2.62 (0.74-9.36) 2.21 (0.61-8.03) |
| Age | 1.03 (1.00-1.05) | 1.07 (1.03-1.11) |
| Male gender | 1.36 (0.81-2.28) | 1.83 (0.86-3.92) |
| ASA ≥ 3 | 1.01 (0.56-1.67) | 1.95 (1.03-3.97) |
| Rectal tumors | 1.24 (0.64-2.41) | 2.15 (0.82-5.62) |
| Laparoscopy | 0.60 (0.33-1.09) | 0.31 (0.15-0.66) |
| TNM stage Stage I Stage II Stage III | - ref 3.16 (1.04-9.60) 23.50 (7.59-72.71) | - ref 4.79 (1.35-16.93) 17.97 (4.79-67.30) |
| Adjuvant systemic therapy | 0.48 (0.24-0.95) | 0.20 (0.07-0.56) |
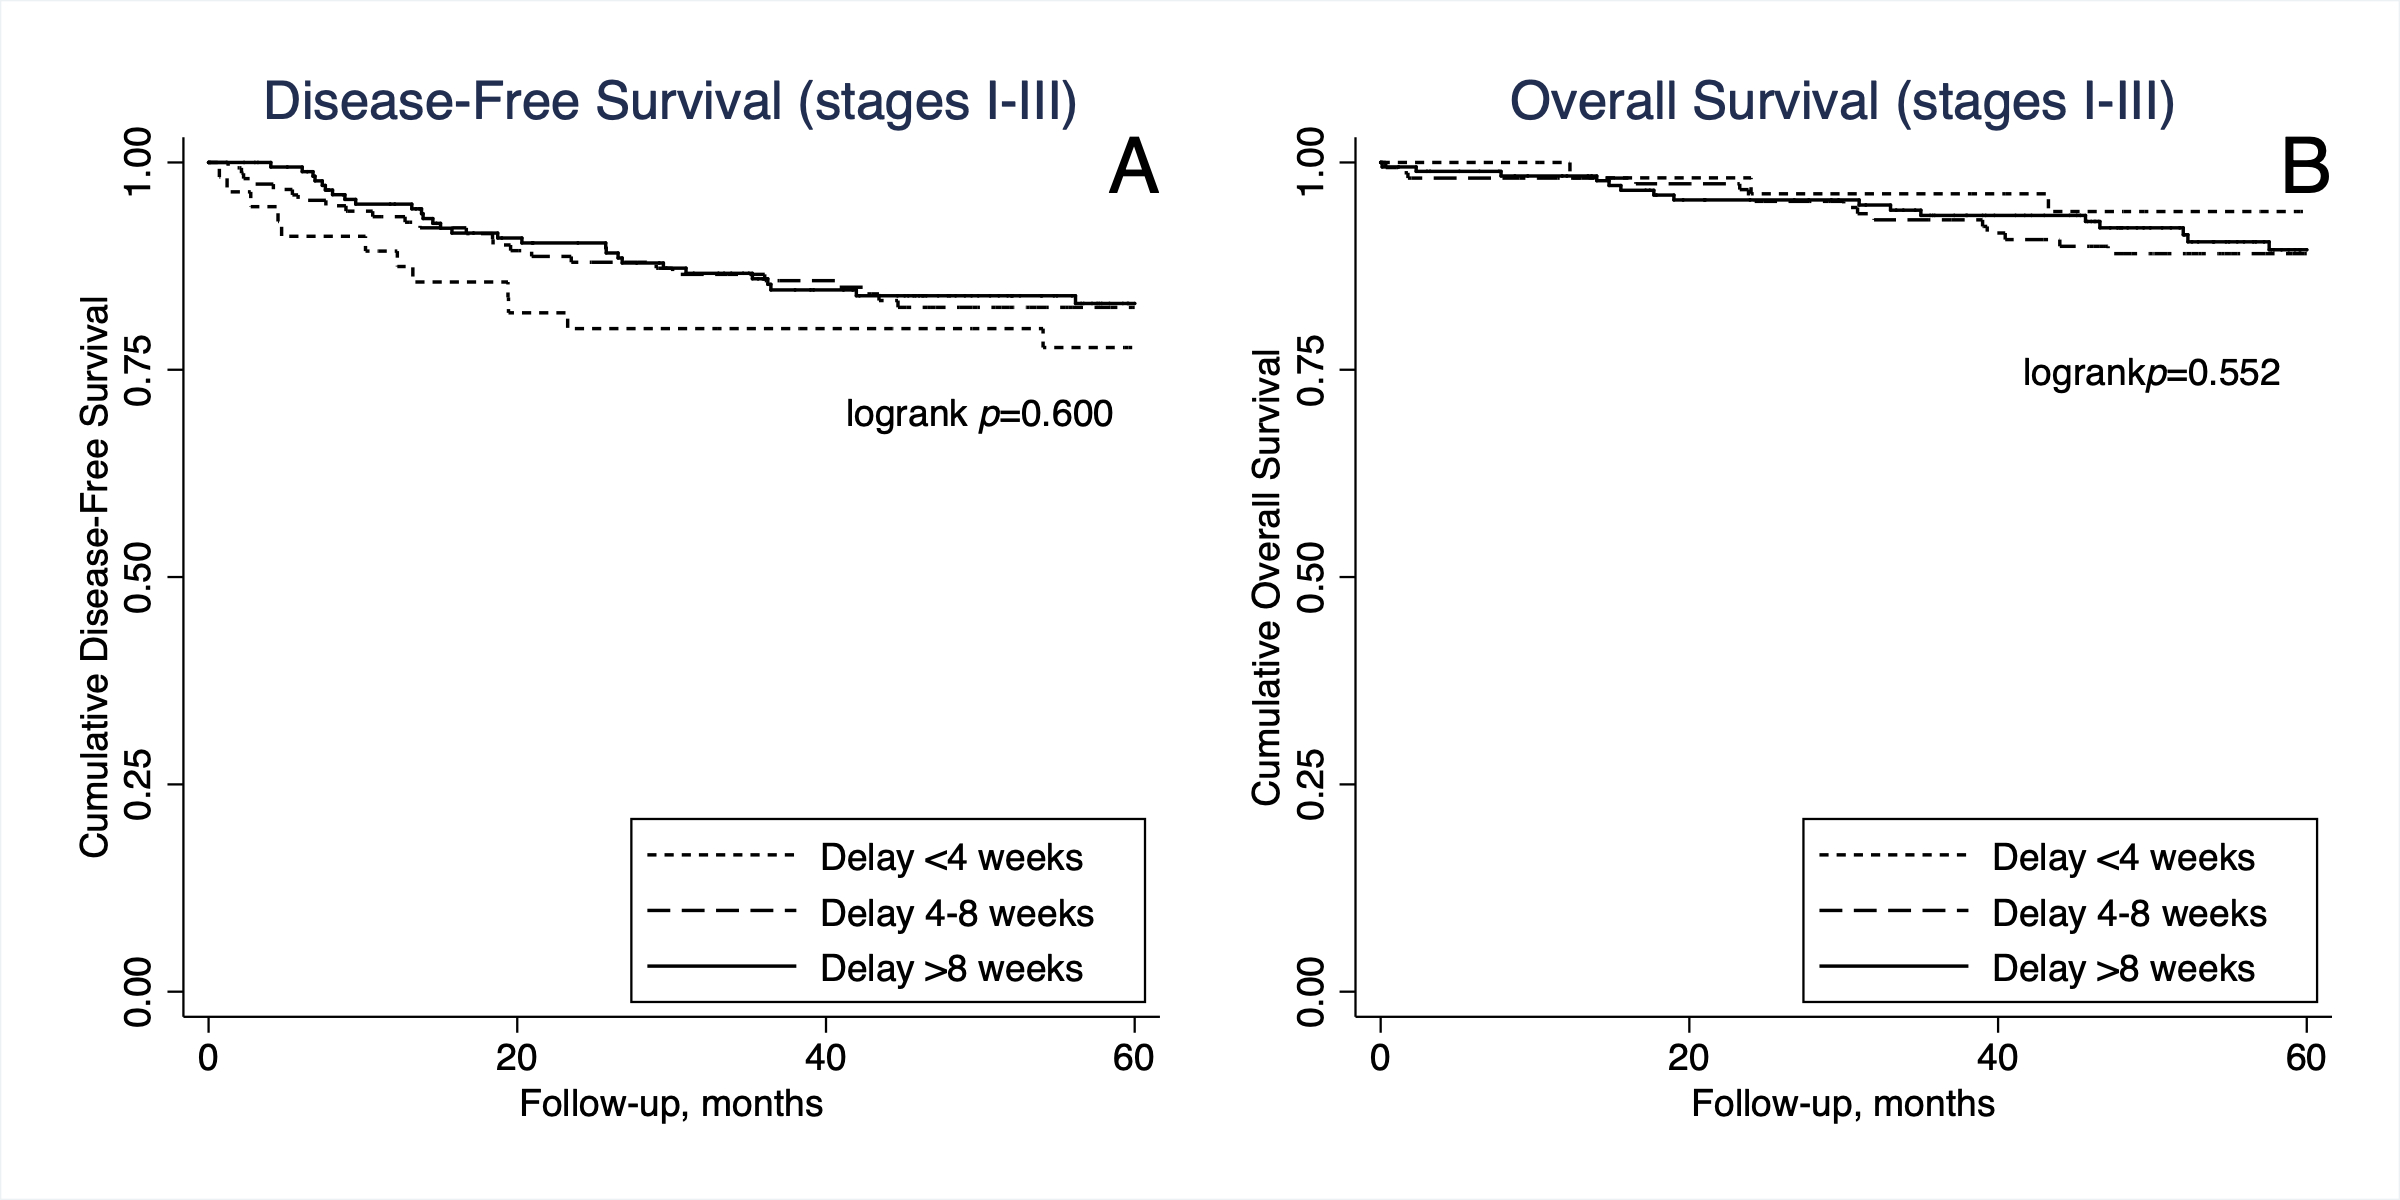
Figure 1 - Kaplan-Meier Survival Curves
Back to 2019 Abstracts


