|
Back to 2014 Annual Meeting Posters
Medicare Diagnosis Related Group Analysis for Laparoscopic Cholecystectomy: Gaps and Opportunities
Pushwaz Virk*1, Maged K. Rizk2, Charu Paranjape1
1Akron General Medical Center, Akron, OH; 2Cleveland Clinic, Cleveland, OH
Background:
To increase procedural efficiency and development of new technologies and processes, Centers for Medicare and Medicaid Services (CMS) makes available Diagnosis Related Group (DRG) data. Laparoscopic Cholecystectomy without Common Duct Exploration with complications or comorbidities and without complications or comorbidities are represented by DRG 418 and 419 respectively. Both of these are among the top 100 DRGs and therefore significant contribution to total Medicare expense. The purpose of this study was to analyze trends and national variations in procedure volume, submitted charges and payments for benchmarking.
Methods:
We studied the Inpatient Diagnosis Related Groups in the MEDPAR Inpatient Hospital National Data for year 2008 to 2011. We also analyzed hospital and state level submitted charge and payment data. Analysis was conducted separately for DRG 418 and 419 as they represent different level in severity of care. Descriptive statistics were used to analyze the data.
Results:
To understand geographical variation, by combining the DRGs, we found that South Dakota, Kentucky and New Jersey had the highest number of discharges per 100,000 Medicare beneficiaries. Lowest rates were in Rhode Island, New Hampshire and Oregon.
For both DRGs Florida and Texas had the highest number of discharges in the year. This can be explained by the large Medicare population in these states.
The total covered charges for DRG 418 significantly increased from $1,119,019,702 in 2008 to $1,652,601,684 in 2011 and total payments increased from $243,066,667 to $279,124,072. Total number of discharges increased from 29,589 to 35,958 and average days decreased from 5.3 to 5.1 in this period.
The total covered charges for DRG 419 increased from $971,790,006 to $1,152,948,923 from 2008 to 2011 but the total reimbursement decreased from $206,013,678 to $169,594,412. Total discharges increased from 36,544 to 35,509 and average total days remained unchanged at 3.
For DRG 419, the highest Medicare payments on average went to Vermont and Maryland while the lowest went to Kansas and Alabama.
For DRG 418, the highest average reimbursement went to Alaska and DC while Alabama and West Virginia had the lowest.
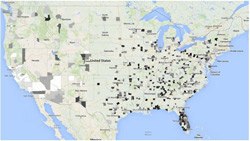
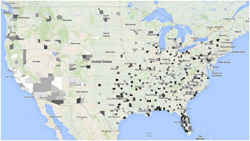
It is also evident that many counties did not have any hospital with more than 10 discharges over the year. County level variation is depicted in the attached figures.
Conclusion:
It is evident that hospital charges have increased on an average in the four year period. Also some states have significantly higher discharges per capita Medicare population. Research is required in translational technologies and efficiencies to standardize the procedures and improve national access.


Back to 2014 Annual Meeting Posters
|


