Background
Adverse gastric symptoms persist in up to 20% of fundoplication surgeries completed for gastroesophageal reflux disease, causing significant morbidity, and driving the need for revisional procedures. Non-invasive techniques to assess the mechanisms of persistent postoperative symptoms are lacking. We aimed to investigate gastric myoelectrical abnormalities and symptoms in patients after fundoplication using a novel non-invasive body surface gastric mapping (BSGM) device.
Methods
Patients with previous fundoplication surgery and ongoing significant gastroduodenal symptoms, and matched controls were included. BSGM using Gastric Alimetry (Alimetry, New Zealand) was employed, consisting of a high resolution 64-channel array, validated symptom-logging App, and wearable reader.
Results
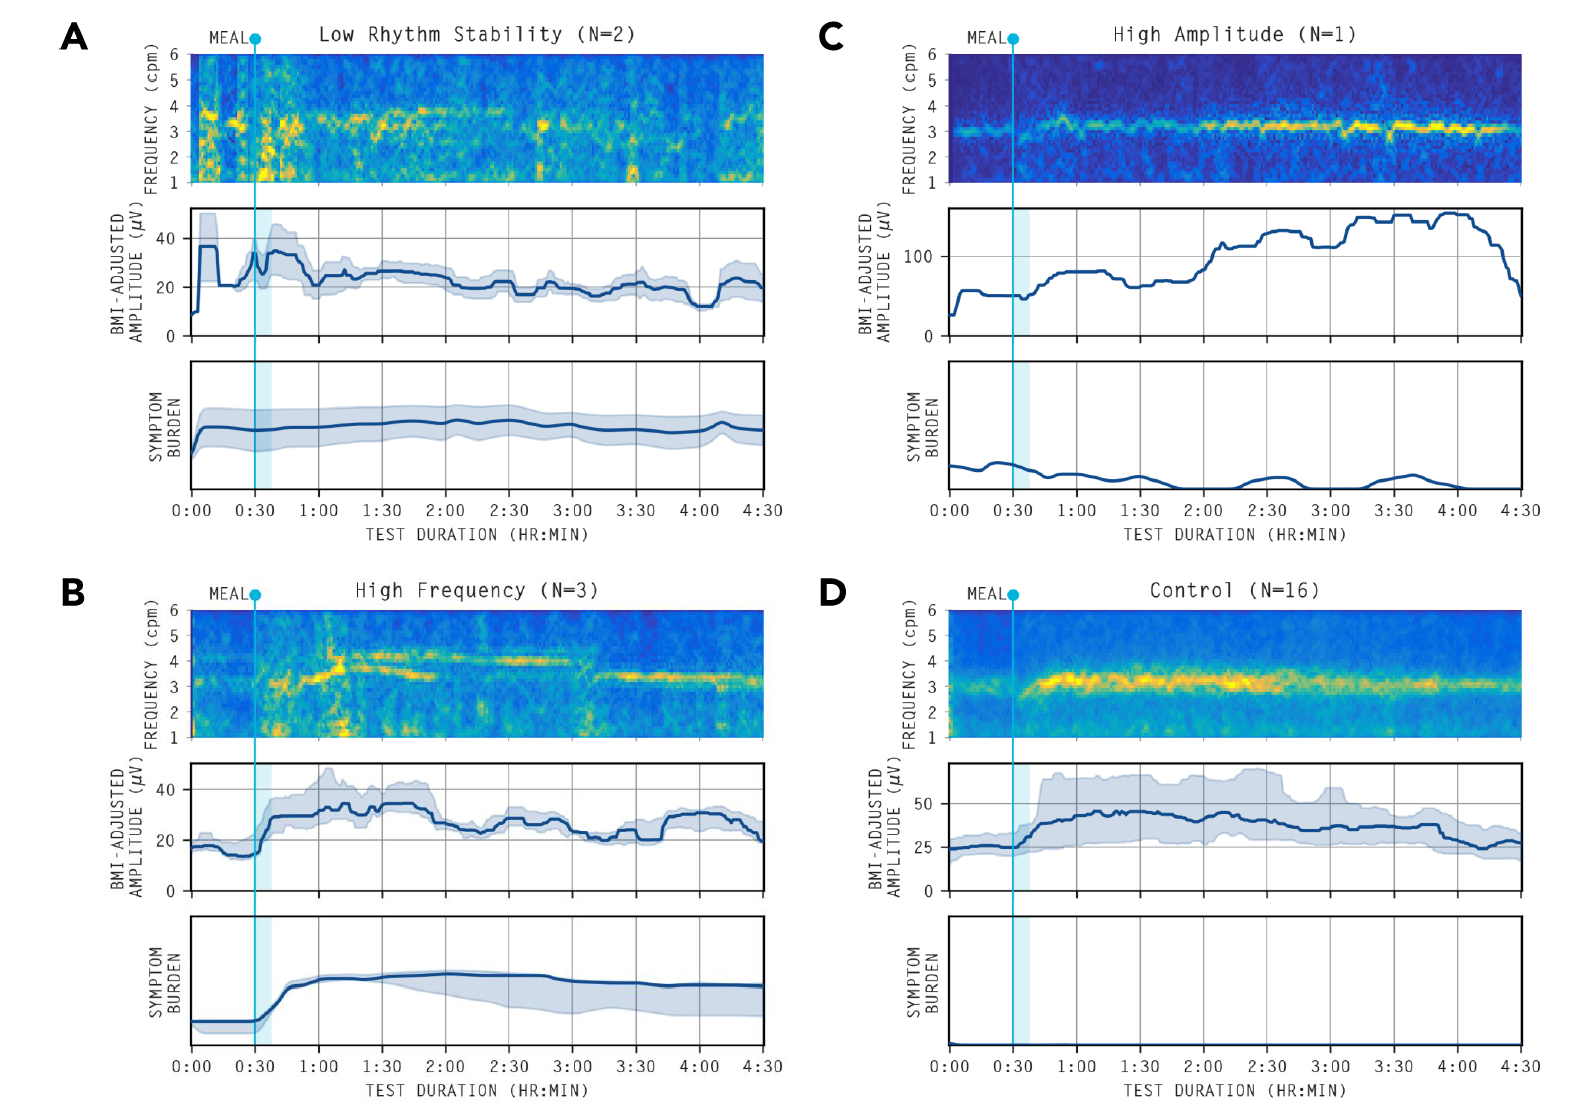
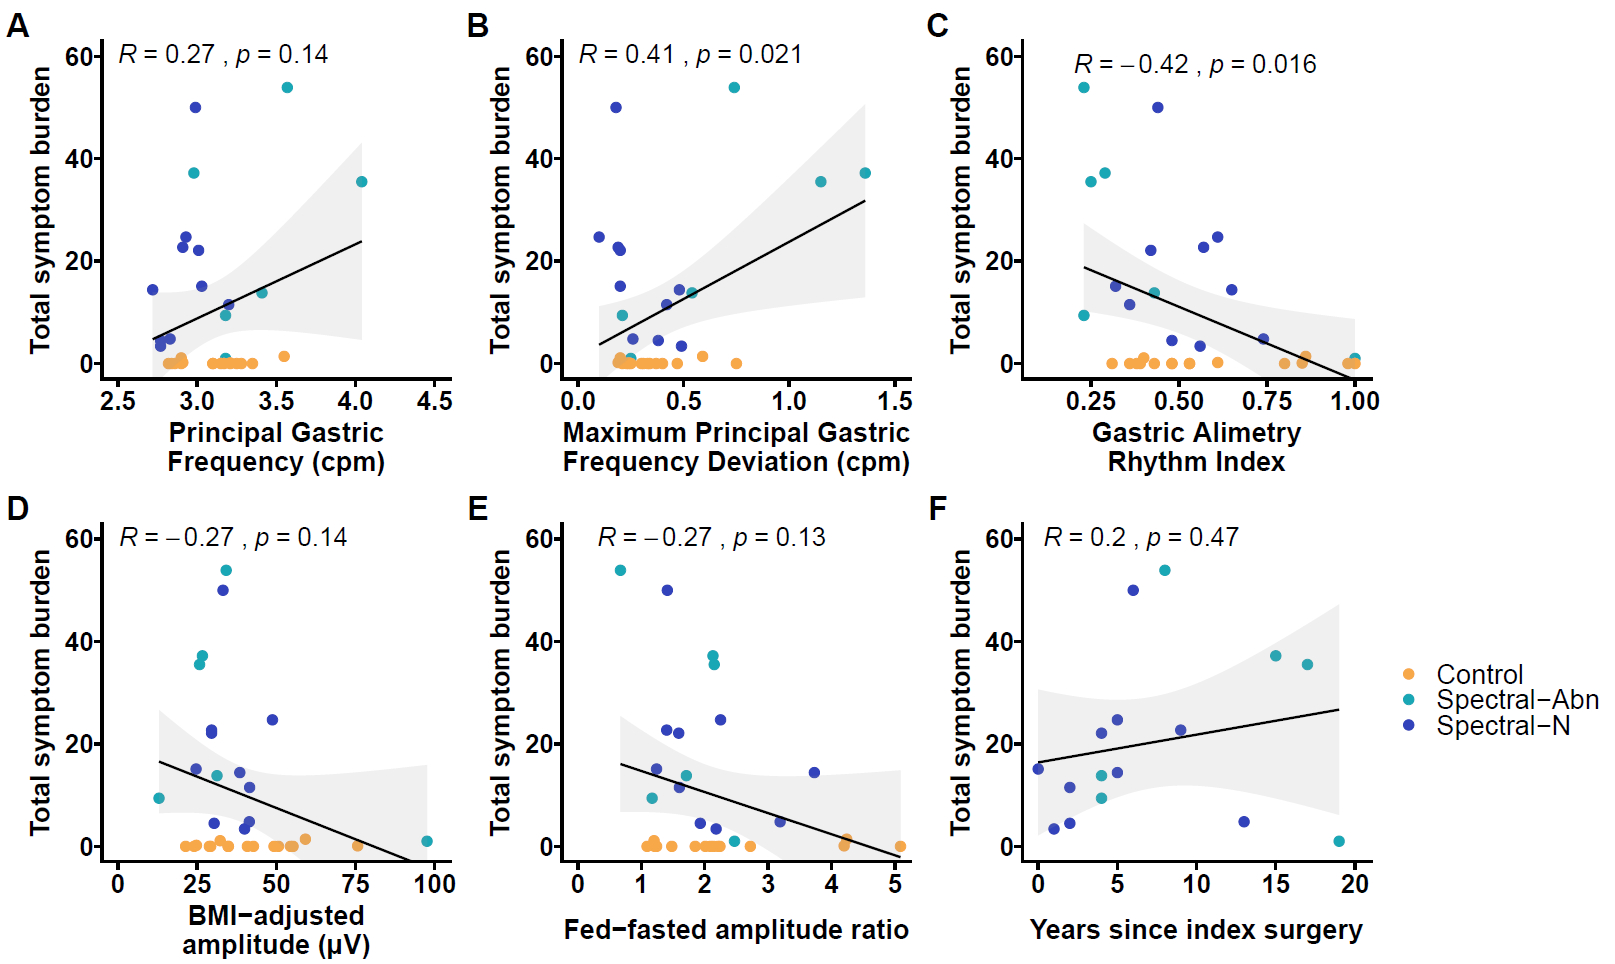
16 patients with significant chronic symptoms post-fundoplication were recruited, with 16 matched controls. Overall, 6/16 (37.5%) patients showed significant spectral abnormalities defined by unstable gastric myoelectrical activity (n = 2), abnormally high gastric frequencies (n = 3) or high gastric amplitudes (n = 1) (Figure 1). Those with spectral abnormalities had higher Patient Assessment of Upper Gastrointestinal Disorders-Symptom Severity Index scores (3.2 [2.8 to 3.6] vs 2.3 [2.2 to 2.8]; p =0.024). 7/16 patients (43.8%) had Gastric Alimetry tests suggestive of gut-brain axis contributions, and without myoelectrical dysfunction. Increasing Principal Gastric Frequency deviation, and decreasing Rhythm Index were associated with symptom severity (r>0.40, p<0.05) (Figure 2).
Conclusion
A significant number of patients with persistent post-fundoplication symptoms display abnormal gastric function on Gastric Alimetry testing, which correlates with symptom severity. These findings advance the pathophysiological understanding of post-fundoplication disorders which may inform diagnosis and patient selection for medical therapy and revisional surgery.

Figure 1: Averaged spectrograms and amplitude curves of abnormal spectrograms
Averaged spectrograms of the abnormal spectral analyses. (A) Gastric neuromuscular dysfunction Gastric rhythm disorder or low amplitude, indicated by Gastric Alimetry Rhythm Index (GA-RI) <0.25, and/or BMI-adjusted amplitude <22 ?V.18 (B) High frequency phenotype: >3.35cpm suggesting possible vagal nerve dysfunction.16 (C) High sustained BMI-adjusted amplitude: >70 ?V suggesting possible gastric outlet resistance.20 (D) Healthy controls.
Figure 2
Scatter plots displaying the association between Total Symptom Burden as measured simultaneously during the Gastric Alimetry Test and (A) Principal Gastric Frequency (cycles per minute) (B) maximum absolute deviation of Principal Gastric Frequency from 3cpm for any 1 hour postprandial period of the test (C) Gastric Alimetry Rhythm Index (D) BMI-adjusted amplitude ÁV (E) Fed-fasted amplitude ratio and (F) Years since index fundoplication surgery.