Introduction:
Younger patients with gastric malignancy are known to present with more aggressive disease than older patients, but there is little data on whether these patients benefit from more aggressive surgical approaches (i.e. total gastrectomy). We examined if younger patients (<40) experienced improved survival compared to older patients (?40) undergoing total gastrectomy.
Methods:
We queried the National Cancer Institute’s SEER database from 2000 to 2018 for patients with gastric adenocarcinoma undergoing total gastrectomy. Patients were divided into two groups based on age at diagnosis: <40 years old (younger) and ?40 (older). Kaplan-Meier curves and corresponding log-rank tests were created to assess the differences in survival probabilities between younger and older patients. A propensity matched subgroup analysis was performed further comparing survival between patients aged <40 vs 40-70. Patients without staging data were excluded. Significance was set at 0.025.
Results:
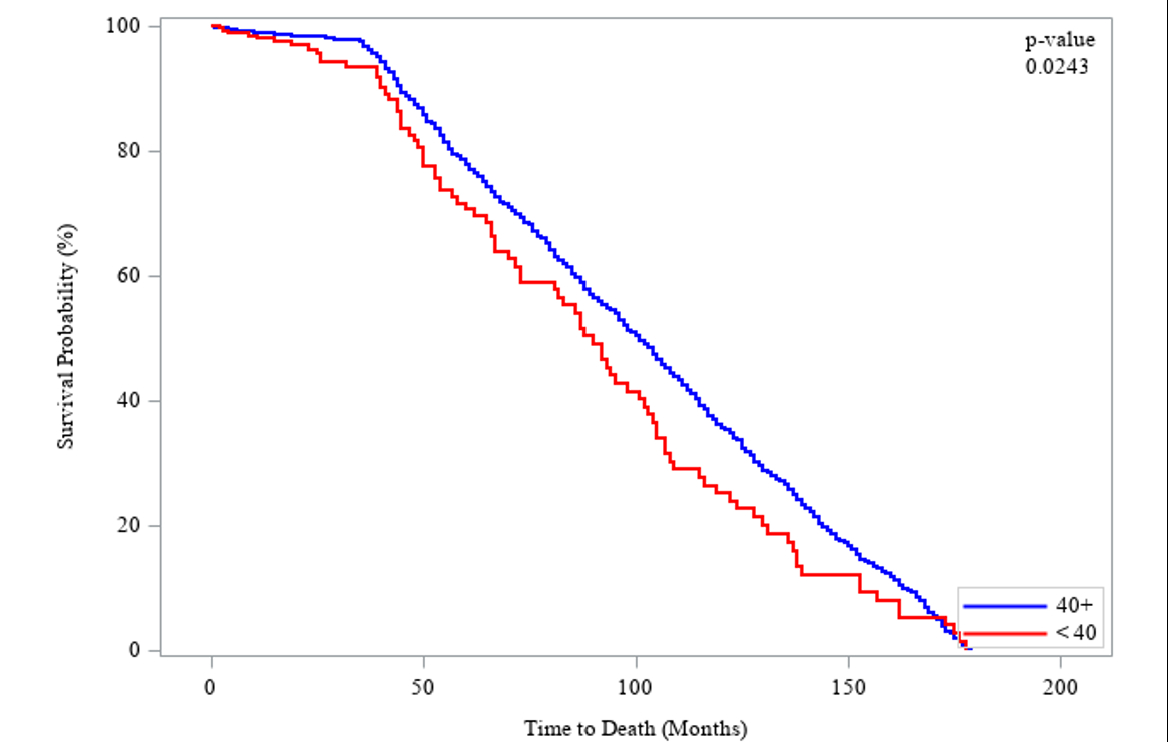
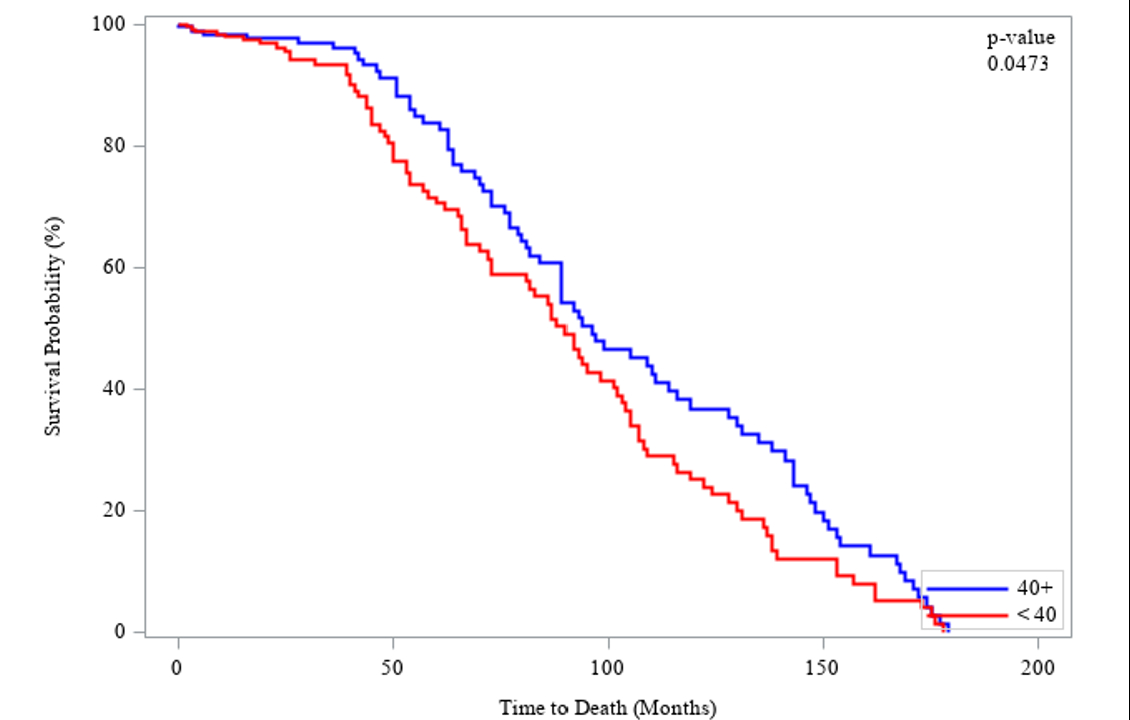
There were 6,345 patients included, with 274 (4.3%) in the younger group. The most common race represented in the younger group was Hispanic (40.2%) while the majority of patients in the older group were non-Hispanic white (50.4%). A higher proportion of patients in the younger group had M1 disease (25.9%) compared to that seen in the older group (12.4%). 72.3% of younger patients had M0 disease compared to 81.1% in the older group. Survival probability was decreased in patients <40 compared to all patients ?40 at 50, 100, and 150 months (p =.0243). However, this effect disappears when applying a propensity matched subgroup analysis to compare survival between those aged <40 vs 40-70 (p=.0473).
Conclusions:
Younger patients undergoing total gastrectomy did not exhibit improved survival compared to older patients.

Kaplan-Meier curve showing survival probably for patients aged <40 vs those >40

Kaplan-Meier curve showing surival probabilties in propensity matched subgroup analysis in patients aged <40 vs those aged 40-70. Participants were matched on the following variables: Sex, Hispanic (All Races), Non-Hispanic White, M0, M1, N0, N2, T2, T3, and T4