Introduction: The body mass index (BMI) is an imperfect clinical measure of obesity, often used in conjunction with other valid measures of weight-related-risk. Our hypothesis is that one of the following would be a superior measure of obesity-related complications: BMI, ponderal index (PI), visceral cross-sectional area (VCSA), subcutaneous fat cross-sectional area (SFCSA), or liver volume (LV).
Methods: The records of patients of a bariatric clinic were reviewed from 2021-2023. Inclusion criteria consisted of age ?18 years and an abdominal computed tomography (CT) scan within one year of visit. The presence of obesity-related comorbidities including hypertension (HTN), diabetes mellitus type 2 (DM), coronary artery disease, stroke, deep vein thrombosis or pulmonary embolism (DVT/PE), gastroesophageal reflux disease (GERD), non-alcoholic fatty liver disease (NAFLD), gallbladder disease, osteoarthritis, and obstructive sleep apnea (OSA) were determined at time of the CT date. BMI was calculated using Weight (kg) / [Height (m)]2 and PI using Weight (kg) / [Height (m)]3. CT scans were reviewed to determine VCSA, SFCSA and LV. VCSA was measured in 2 dimensions from the edges of the coelomic cavity at L1. SFCSA was estimated by subtracting VCSA from abdominal cross-sectional area at L1. LV was measured using the method described by Seppelt: (ML x DV x CC)/3.6 cm, where ML is medial-lateral, DV is dorsal-ventral, and CC is cranial-caudal. Data was analyzed using the Kruskal-Wallis test and Mann-Whitney U test.
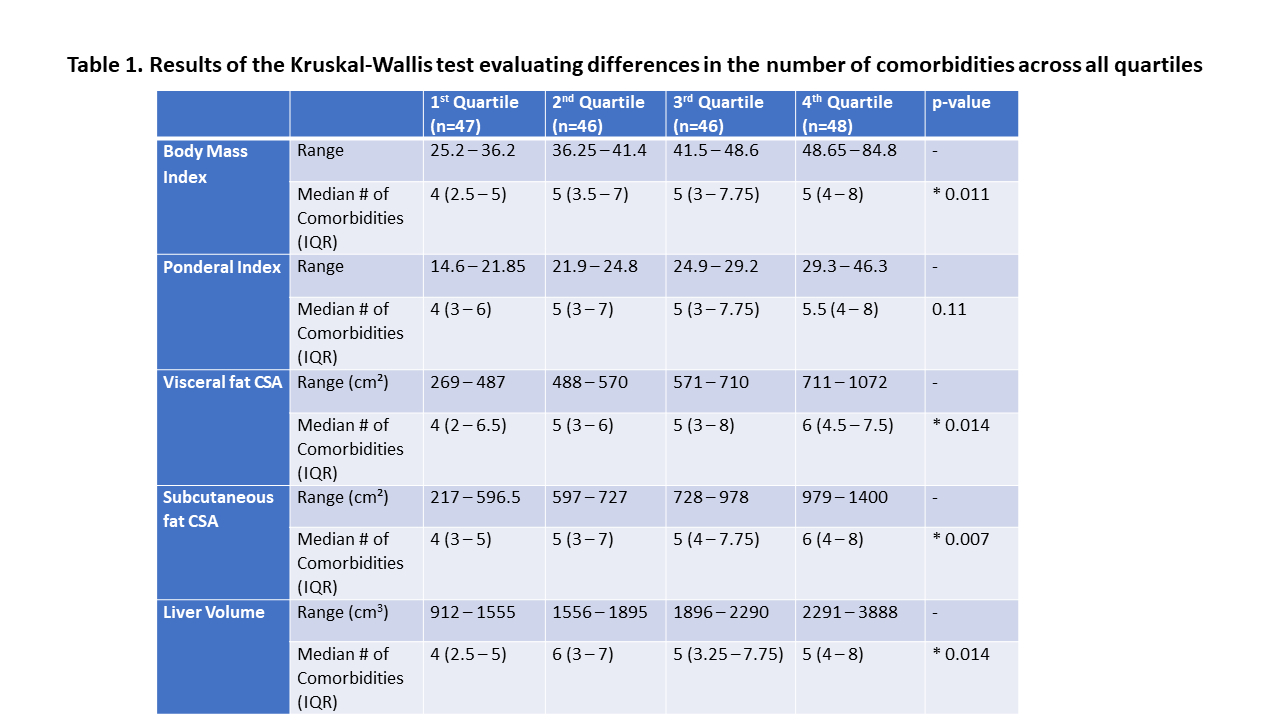
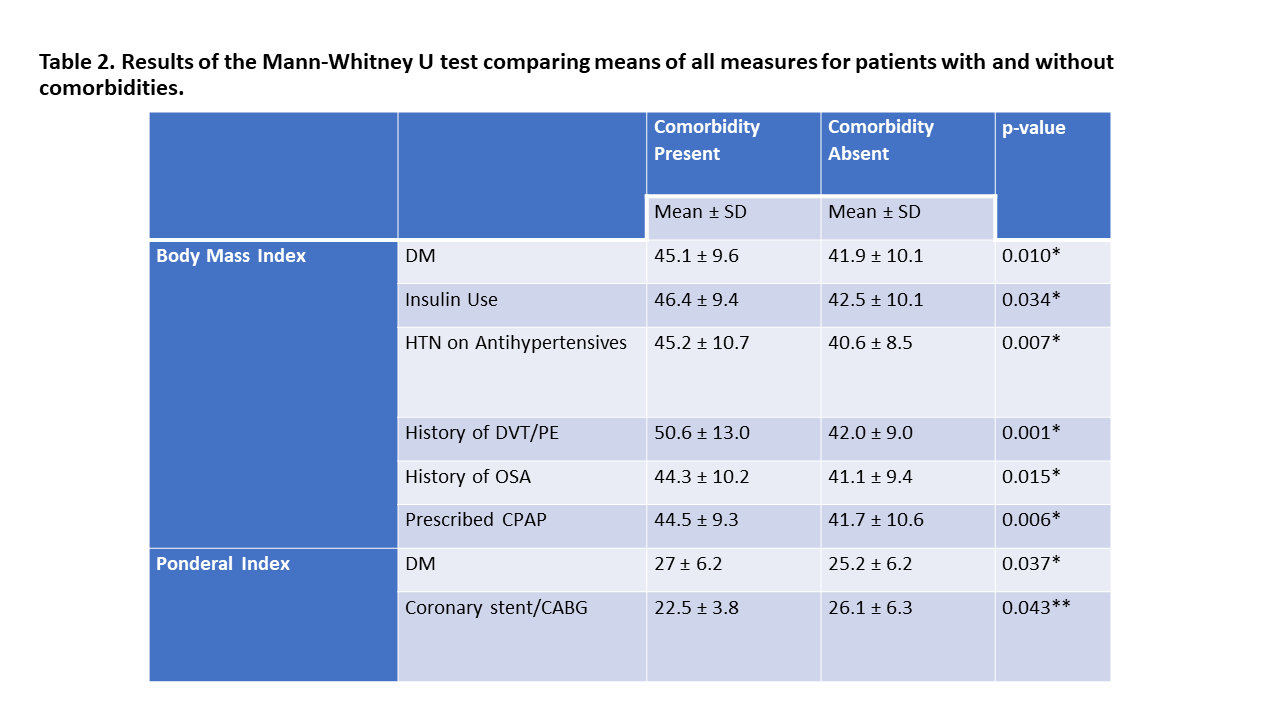
Results: Of the 187 patients included, 75% were female. The mean age was 48.1 � 12.6. Median BMI was 41.5 (IQR 36.2-48.7); the median PI was 24.8 (IQR 21.8-29.2). Table 1 presents the results after stratifying patients into quartiles based on the respective measures. A higher number of comorbidities were found to be associated with a larger BMI (p=0.011), VCSA (p=0.014), SFCSA (p=0.007), and LV (p=0.014), but not a larger PI (p=0.11). Of the 16 comorbidities assessed, VCSA and LV were each significantly associated with 7, BMI and SFCSA with 6, and PI with 4 (Table 2). However, each measure could be associated with different comorbidities. A higher BMI was associated with increased insulin use (p=0.034), HTN (p=0.007), and a history of OSA (p=0.015), none of which were associated with PI. BMI and PI were the only measures associated with a history of DVT/PE (both p<0.01). Only SFCSA was found to be associated with GERD (p=0.029). VCSA (p=0.038) and LV (p=0.001) were associated with NAFLD. A lower PI was associated with a history of coronary stenting or coronary artery bypass graft (CABG) (p=0.043), while a smaller LV was associated with a history of cholecystectomy (p=0.012).
Conclusions: No single measure could account for all obesity-related comorbidities, implying the need for targeted measurements. However, the PI was the least effective measure.