Back to 2024 Abstracts
ORAL MICROBIOME SIGNATURES AS POTENTIAL BIOMARKERS FOR GASTRIC CANCER RISK ASSESSMENT
Shruthi R. Perati
*1, Mykhaylo Usyk
2, Alexandra Adams
3, Brijesh Rana
3, Julie Yang
4, Srawani Sarkar
2, Fei Wang
2, Laurence P. Diggs
5, Christopher C. Sollecito
2, Robert D. Burk
2, Haejin In
31Department of Surgery, Rutgers Robert Wood Johnson Medical School, New Brunswick, NJ; 2Department of Pediatric (Genetic Medicine), Albert Einstein College of Medicine, Bronx, NY; 3Division of Surgical Oncology, Rutgers Cancer Institute, New Brunswick, NJ; 4Division of Gastroenterology, Mount Sinai Hospital, New York, NY; 5Department of Surgical Oncology, The University of Texas MD Anderson Cancer Center, Houston, TX
Introduction:Gastric cancer (GC) is the third leading cause of cancer-related death in the world and a contributing factor for cancer disparities in the United States. The oral microbiota was investigated for distinguishable characteristics between GC, premalignant gastric conditions (Pre-GC) and healthy control patients.
Methods:Prospectively collected swish-and-spit oral samples of GC, Pre-GC, and control patients at a tertiary care center were analyzed for alpha diversity, beta diversity, and Analysis of Compositions of Microbiomes (ANCOM). Receiver operating characteristic curves with corresponding area under the curve calculations were performed to evaluate the discriminative power of models.
Results:Oral samples from 99 patients included 30 (30.6%) GC, 30 (30.6%) Pre-GC and 38 (38.8%) controls. Of these, 61 (62.2%) were female, 31 (31.6%) were Hispanic, 30 (30.6%) were diabetics, and 18 (18.3%) were smokers.
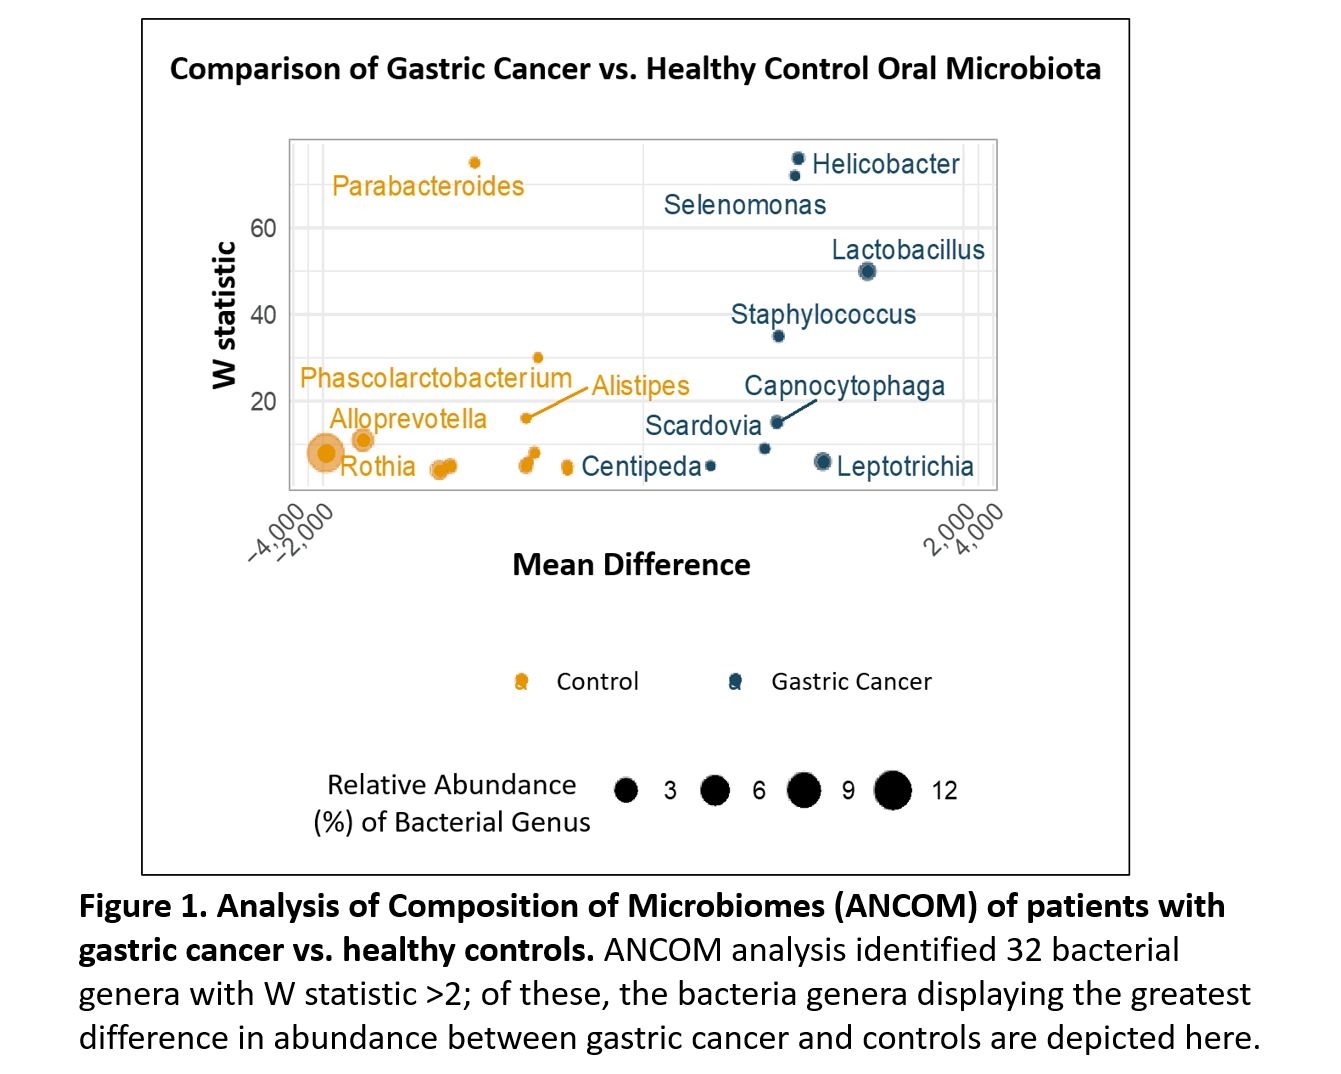
GC and controls demonstrated notable differences in beta diversity (Jensen-Shannon Divergence p=0.019; Bray-Curtis Dissimilarity p=0.016). ANCOM analysis identified 32 bacterial genera with W statistic (a measure of differential abundance between groups) greater than 2, including
Helicobacter,
Selenomonas, Lactobacillus and
Staphylococcus which were more abundant in GC, and
Parabacteroides, Alloprevotella, Rothia and
Phascolarctobacterium which were more abundant in controls (Figure 1).
For Pre-GC compared to controls, no discernable difference in beta diversity (Jensen-Shannon Divergence p=0.679, Bray-Curtis Dissimilarity p=0.491) was detected. Nevertheless, ANCOM analysis identified 23 bacterial genera with W statistic >2. Bacteria genus displaying the greatest difference in abundance between Pre-GC and controls closely resembled those identified in the GC versus control analysis. Furthermore, ANCOM analysis comparing GC and Pre-GC indicates that their composition is similar, with only three bacterial genera with W-statistic >2.
To harness these insights, the 13 bacterial genera that exhibited the most significant differences between Pre-GC and controls were utilized to construct a model. The 10-fold cross validation model demonstrated good ability to discriminate using bacteria alone (area under the curve = 0.74) and was further improved with the addition of clinical variables, including demographics and comorbidities (area under the curve = 0.91).
Conclusions:Oral microbiota of both GC and Pre-GC patients exhibited distinct microbiome profiles, distinguishing them from the control group. This compositional difference raises the possibility of utilizing these microbial signatures as potential biomarkers for assessing GC risk and underscores the importance of further exploring the oral microbiome.
Back to 2024 Abstracts


