Back to 2024 Abstracts
PREOPERATIVE PREDICTION OF POST HEPATECTOMY LIVER FAILURE AFTER SURGERY FOR HEPATOCELLULAR CARCINOMA ON CT-SCAN BY ARTIFICIAL-INTELLIGENCE AND RADIOMICS ANALYSES
Simone Famularo
*1,2, Matteo Donadon
3, Flavio Milana
1, Cesare Maino
7, Michele Diana
2, Felice Giuliante
4, Francesco Ardito
4, Roberto Troisi
5, Gian Luca Grazi
6, Jacques Marescaux
2, Guido Torzilli
11Dept. of Surgery, Hepatobiliary and general surgery division, IRCCS Humanitas Research Hospital, Rozzano, Lombardia, Italy; 2IRCAD France, Strasbourg, Grand Est, France; 3Universita degli Studi del Piemonte Orientale Amedeo Avogadro, Novara, Piemonte, Italy; 4Fondazione Policlinico Universitario Agostino Gemelli IRCCS, Roma, Lazio, Italy; 5Azienda Ospedaliera Universitaria Federico II, Napoli, Campania, Italy; 6Universita degli Studi di Firenze, Firenze, Toscana, Italy; 7Fondazione IRCCS San Gerardo dei Tintori, Monza, Lombardia, Italy
Introduction. Post hepatectomy liver failure (PHLF) is associated with high risk of failure-to-rescue and mortality after liver resection for hepatocellular carcinoma (HCC). Its diagnosis is prevalently clinical in the post operative course. The aim of this study was to train machine-learning models to predict the occurrence of PHLF by the preoperative CT scan combined with clinical parameters.
Methods. Clinical data and 3-phases CT scans were retrospectively collected among 12 Italian centres. DICOM files were manually segmented to detect the liver and the tumor(s). LIFEex was used to automatically extract radiomics features from the healthy liver areas in each phase (fig.1). Data obtained were explored and principal component analysis (PCA) was performed to reduce the dimensions of the dataset, keeping only the PC's explaining 75% of the variability. After normalization, data were divided between training (70%) and test (30%) sets. An oversampling was run (ADASYN) in the training set to overcome the imbalance among the target variable. Random-Forest (RF), and extreme gradient boosting (XGB) models were fitted to predict PHLF. Hyperparameters tuning was made per each model to reduce the out-of-bag error by grid search. The training was run in the training set, and the best parameters were estimated in a validation cohort created by 10-fold cross validation. Final evaluation of the metrics was run in the test set. Isotonic calibration was applied to each model prediction. The area under the curve (AUC) was estimated by ROC analysis and settled as the primary endpoint.
Results. Between 2008 and 2022, 500 consecutive preoperative CT scans of patients affected by HCC and submitted to surgery were collected with the relative clinical data. Of them, 17 (3.4%) experienced a PHLF. The Jaccard index between manual and algorithm segmentations was overall 90%. First and second order radiomics features were extracted, obtaining 672 variables per patient. After data exploration, PCA selected 19 dimensions explaining >75% of the variance. The clinical variables selected by logistic regression were size, macrovascular invasion, cirrhosis and MELD score. After the dataset splitting, a training cohort (n=351) and a test cohort (n=149) were created. The XGB model obtained in the test set an AUC=89.4% (Spec.=100%, Sens.=20%, accuracy=97.3%, PPV=20%, NPV=97.2%, fig.2). The RF model obtained an AUC=89.1% (Spec.=70.1%, Sens.=100%, accuracy= 71.1%, PPV=10.4%, NPV=100%).
Conclusion. Our model allowed an impressive prediction accuracy of the occurrence of PHLF at the time of HCC diagnosis. This could lead to change the treatment allocation, the surgical extension and the postoperative management for those patients. The algorithm will be freely distributed online for medical purpose.
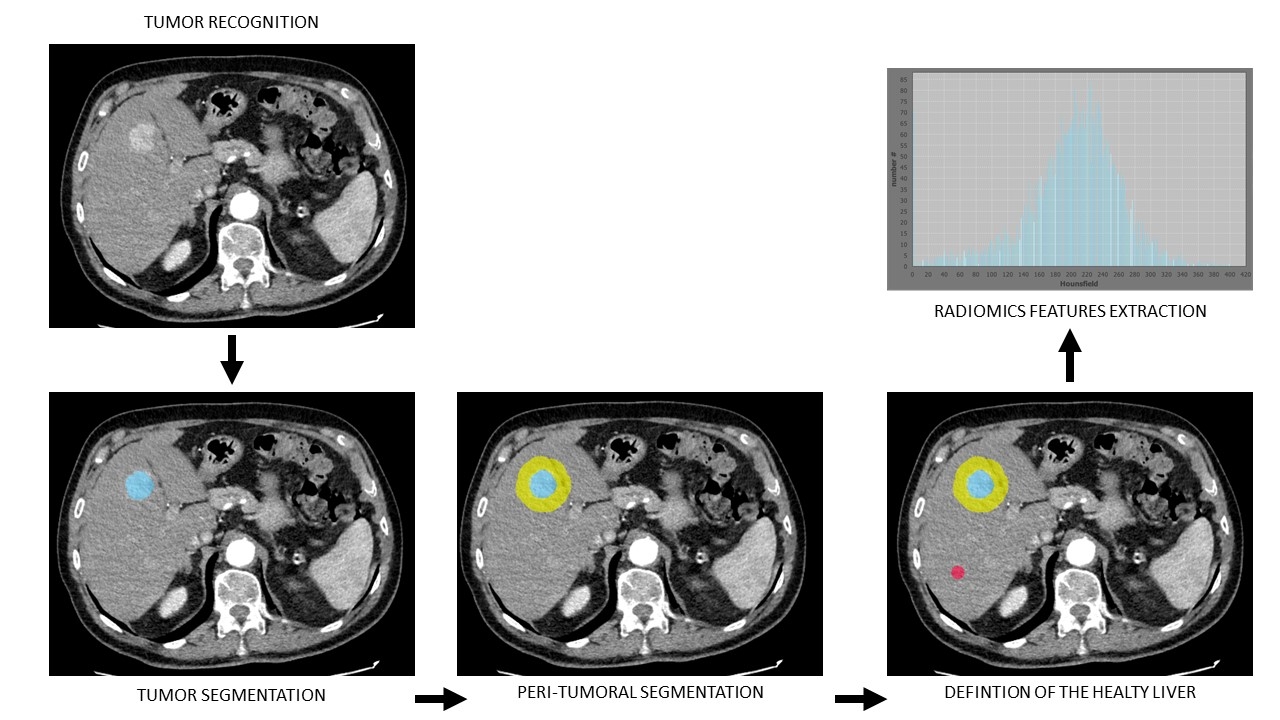
Steps followed to manually segment the liver, the tumor, the peritumoral area and the healthy liver area by the creation of a 2D-region of interest (ROI). Then, radiomics features extraction was made by LIFEex in the selected ROI.
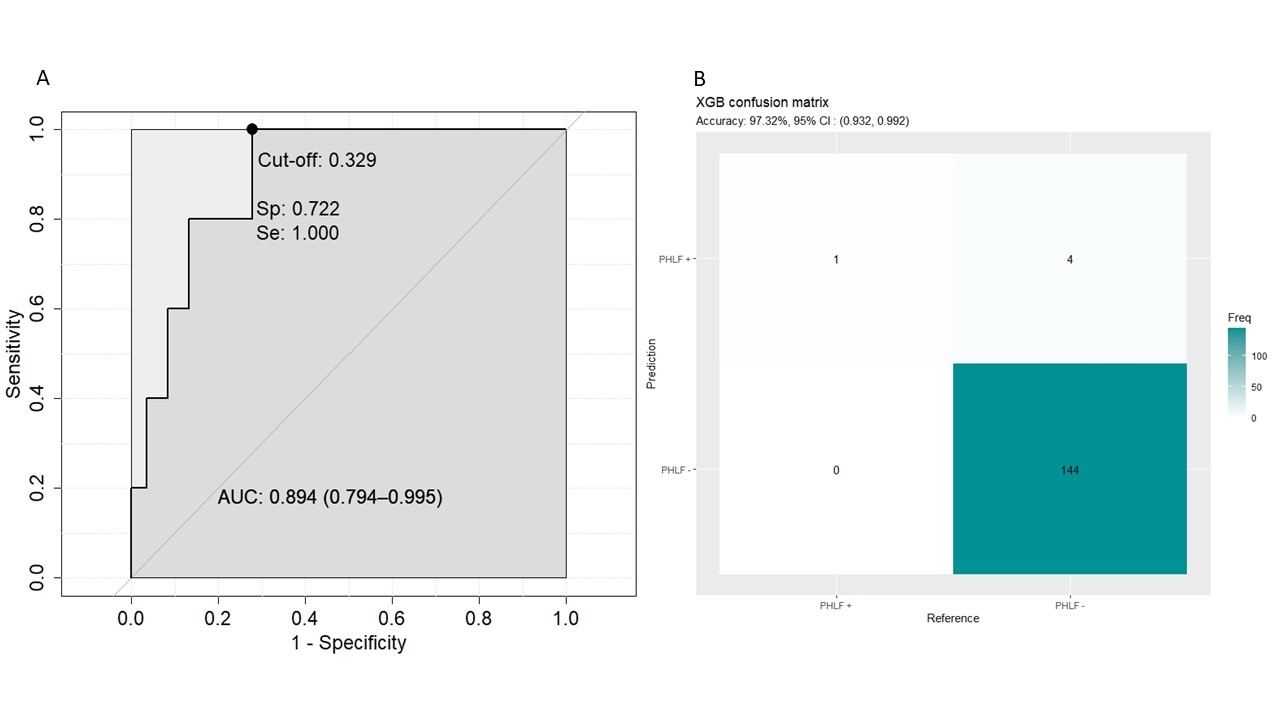
The ROC curve and the confusion matrix of the XGB model measured in the test-set.
Back to 2024 Abstracts


