|
 |
Back to 2018 Posters
REDUCTION IN MORTALITY AND INCREASE IN HOSPITAL CHARGES FOR LAPAROSCOPIC GASTRIC BYPASS - A NATIONWIDE ANALYSIS FROM 2003 - 2013
Daniel Castaneda*2, Violeta Popov2, Marc Georgi3, Christopher C. Thompson1
1Brigham & Women's Hospital, Boston, MA; 2NYU School of Medicine, New York, NY; 3Catalyst Medical Consulting, Baltimore, MD
Introduction
Bariatric surgery has been shown to improve obesity-related comorbidities, and laparoscopic gastric bypass (LGB) is one of the most durable and effective procedures. However, the in-hospital outcomes for patients undergoing LGB is yet to be determined. We aimed to analyze the mortality, length of stay and total hospitalization charges trends in patients hospitalized for LGB between 2003 and 2013 in the United States.
Methods
This was a retrospective cohort analysis using the 2003, 2008 and 2013 National Inpatient Sample database. All patients with ICD-9 CM codes for a primary diagnosis of LGB were included. Our primary outcome were in-hospital mortality, length of stay and total hospitalization charges after LGB. Proportion analysis was performed to estimate mortality trends in the studied period. Odds ratios for mortality were calculated using univariate regression analysis, adjusted for age, sex, race, median income in the patient's zip code, major comorbidities (heart failure, renal failure, liver disease, chronic lung disease, diabetes and alcoholism), hospital region/location and teaching status. Multivariate analysis was performed among statistically significant risk factors in univariate analysis. Year-adjusted means were calculated for total charges and length of stay trend analysis.
Results
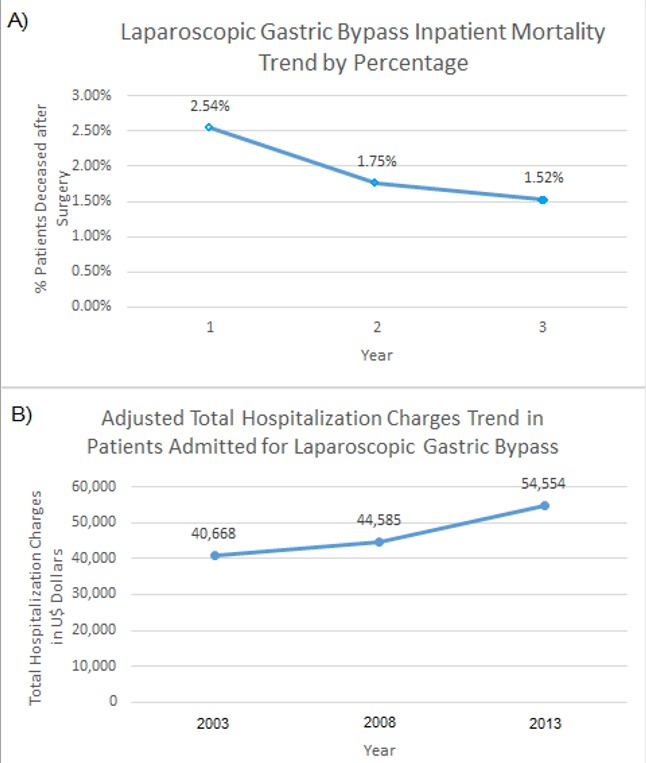
A total of 46,735 patients admitted for LGB were included. Mean age was 69.73 years and 46% were female. The majority of the patients were Caucasian (69.5%). The number of procedures requiring hospitalization decreased through the analyzed years, from 18,078 patients in 2003 and 17,127 in 2008 to 11,530 in 2013. In-hospital mortality decreased from 2.54% in 2003 to 1.52% in 2013, as shown in Figure 1 (p=0.004). Adjusted total hospitalization charges increased from 2003 to 2013 by 34.1% (p<0.001), presenting an initial cost of U$40,668 per hospitalization in 2003 in contrast to U$54,554 in 2013. Total length of stay decreased from 5.86 days in 2003 to 4.81 days in 2008 (p<0.001) and reached a plateau in 2013 with 5.17 days. Adjusted odds ratios, means and p values for univariate analysis are shown in Table 1. On multivariate analysis, renal failure, coagulopathy and advanced age were the only factors associated with an increased mortality risk in our cohort.
Discussion
Mortality after laparoscopic gastric bypass surgery has decreased significantly from 2003 to 2013, while the total hospital charges have increased significantly throughout the decade. A more vigilant management and selection criteria must be considered in candidates for LGB with renal failure, coagulopathy or advanced age due to an increased mortality risk.
Table 1. Univariate and multivariate analysis for mortality risk factors in patients undergoing laparoscopic gastric bypass between 2003 and 2013.
| RISK FACTORS FOR MORTALITY IN PATIENTS UNDERGOING LGB | | | 2003 | 2008 | 2013 | | | Univariate | Multivariate | Univariate | Multivariate | Univariate | Multivariate | | Advanced Age | 1.05 (1.03-1.06), p<0.001 | 1.04 (1.01-1.06), p=0.005 | 1.05 (1.03-1.07), p<0.001 | 1.04 (1.02-1.06), p=0.001 | 1.03 (1.003-1.06), p=0.027 | 1.03 (0.99-1.06), p=0.074 | | Female | 0.97 (0.64-1.47), p=0.89 | N/A | 1.58 (0.84-2.97), p=0.16 | N/A | 1.23 (0.63-2.41), p=0.548 | N/A | | Race | 0.88 (0.69-1.12), p=0.3 | N/A | 0.99 (0.76-1.28), p=0.92 | N/A | 0.79 (0.53-1.17), p=0.24 | N/A | | Heart Failure | 3.83 (2.47-5.93), p<0.001 | 2.72 (1.39-5.34), p=0.004 | 2.78 (1.48-5.25), p=0.002 | 2.10 (0.98-4.46), p=0.055 | 1.54 (0.63-3.74), p=0.34 | N/A | | Renal Failure | 5.37 (3.49-8.28), p<0.001 | 8.64 (4.52-16.54), p<0.001 | 2.64 (1.63-4.29), p<0.001 | 2.73 (1.56-4.81), p<0.001 | 2.00 (1.01-3.97), p=0.046 | 2.51 (1.14-5.53), p=0.02 | | Liver Disease | 6.43 (2.11-19.54), p=0.001 | 2.55 (0.56-11.56), p=0.22 | 2.11 (0.28-15.90), p=0.47 | N/A | N/A | N/A | | Coagulopathy | 9.49 (4.15-21.72), p<0.001 | 7.59 (2.86-20.18), p<0.001 | 7.29 (3.33-15.96), p<0.001 | 8.27 (3.34-20.47), p<0.001 | 4.52 (1.52-13.47), p=0.007 | 4.87 (1.30-18.22), p=0.02 | | Chronic Lung Disease | 1.37 (0.85-2.22), p=0.2 | N/A | 0.20 (0.30-1.17), p=0.13 | N/A | 1.56 (0.77-3.15), p=0.22 | N/A | | Controlled Diabetes | 0.64 (0.40-1.04), p=0.072 | N/A | 0.74 (0.43-1.30), p=0.30 | N/A | 0.59 (0.26-1.36), p=0.21 | N/A | | Complicated Diabetes | 1.25 (0.62-2.51), p=0.533 | N/A | 0.81 (0.32-2.03), p=0.65 | N/A | 0.85 (0.30-2.43), p=0.76 | N/A | | Alcoholism | 1.28 (0.30-5.39), p=0.74 | N/A | N/A | N/A | 1.93 (0.45-8.26), p=0.37 | N/A | | Teaching Hospital | 0.84 (0.63-1.13), p=0.25 | N/A | 1.002 (0.66-1.53), p=0.99 | N/A | 0.85 (0.51-1.44), p=0.56 | N/A | | Hospital Location | 0.73 (0.60-0.89), p=0.002 | N/A | 1.05 (0.74-1.51), p=0.77 | N/A | 0.77 (0.55-1.09), p=0.14 | N/A | | ZIP code | 0.97 (0.80-1.18), p=0.78 | N/A | 1.04 (0.83-1.31), p=0.73 | N/A | 1.22 (0.90-1.67), p=0.21 | N/A |
Results are listed by odds ratio (OR), 95% confidence intervals (95% CI) and p-value per each year.  Figure 1. Laparoscopic gastric bypass inpatient mortality (A) and adjusted hospitalization charges (B) in the United States between the periods 2003 to 2013.
Back to 2018 Posters
|

