
|
|
Back to 2017 Posters
THE EFFECT OF MID-YEAR REPORT CARDS ON COLONOSCOPY QUALITY MEASURES
Kunal Suradkar*1, Benjamin Lebwohl2, Ravi P. Kiran1, Steven Lee-Kong1
1Division of Colorectal Surgery, Columbia University Medical Center / New York Presbyterian Hospital, New York, NY; 2Division of Gastroenterology, Columbia University Medical Center / New York Presbyterian Hospital, New York, NY
Introduction - Prior studies have demonstrated that routine reporting of quality metrics of screening colonoscopy helps to improve adherence to established guidelines. Since 2011, our institution has distributed annual reports, in June of each year, to providers. These reports include personalized data with regard to adenoma detection rate (ADR), colonoscope withdrawal time (CW) and cecal intubation (CI) rate, using standardized digital reporting systems.
Aim - We aimed to investigate whether distribution of individualized reports of quality colonoscopy quality metrics at the mid-point of each year, improves colonoscopy outcomes in the latter half of each year.
Methods - Providers with endoscopy privileges at New York Presbyterian Hospital, Columbia University Medical Center throughout the five-year period spanning 2011-2015 were included in the study, and were included in the annual reporting system. Providers who performed ≥20 screening colonoscopies per year were included in this analysis. The three metrics recorded and reported on were ADR, CW and CI. Standard benchmark rates for these metrics were considered when evaluating providers. The mean values of each metric from January through June (1st half) and July through December (2nd half) were calculated using the paired student t-test and year-wise distribution was plotted using the curve estimation tests.
Results - Fifteen providers were eligible for the study. The collective ADR in the 1st half of all years was 26.9%, and in the second half of all years was 28.03% (p=0.476). The CW for all years was more than 9 min (mean = 10.35, 10.19, 11.47, 10.53, 10.46 in the years 2011, 2012, 2013, 2014, and 2015 respectively). CI for all years was above 95% for all providers (average = 97.72%, 97.42%, 97.28%, 97.67%, and 98.51% for years 2011, 2012, 2013, 2014, and 2015 respectively). There was no significant increase in the CI and CW during the 5-year study period. The overall ADR was 26.43% in 2011 and was 33.47% in 2015. There was a trend toward improved ADR during this five-year time period, but this did not meet statistical significance (p=0.137). When examining ADR during each of the 12 months following the June report cards, there was no month-to-month trend observed (p=0.893). While not statistically significant, there was a trend in the improvement for the 3 lowest performing providers (E, H, and M) in the cohort.
Conclusion - We did not observe a rise in ADR following the distribution of annual report cards. The long-term effects of periodic feedback to endoscopists requires further study. For providers who already meet/exceed benchmark quality metrics, routine reporting may maintain, but not improve, outcomes. Perhaps, focusing these types of reports on low-performing providers may be more useful.
ADR for 15 providers 1st half (2011 - 15) and 2nd half (2011 - 15)
| Providers | January - June | July - December | p value | | A | 32% | 24% | 0.346 | | B | 29% | 22% | 0.347 | | C | 36% | 20% | 0.129 | | D | 25% | 28% | 0.378 | | E | 19% | 26% | 0.114 | | F | 35% | 46% | 0.111 | | G | 31% | 33% | 0.794 | | H | 19% | 26% | 0.357 | | I | 28% | 24% | 0.704 | | J | 24% | 27% | 0.252 | | K | 29% | 32% | 0.352 | | L | 28% | 31% | 0.507 | | M | 15% | 21% | 0.085 | | N | 31% | 35% | 0.558 | | O | 21% | 25% | 0.611 |
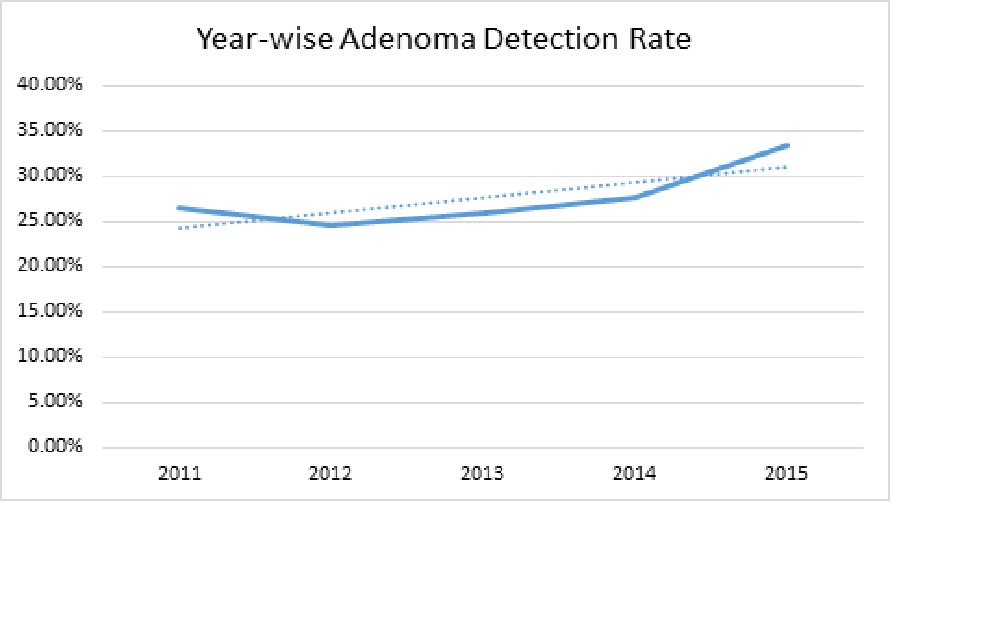 Year-wise Adenoma Detection Rate X axis - Years Y axis - Adenoma detection rate
Back to 2017 Posters
|

