|
Back to 2017 Program and Abstracts
APPENDICEAL ADENOCARCINOMA AND NEUROENDOCRINE TUMORS: A COMPARATIVE ANALYSIS OF SURVIVAL PROFILE AND ITS PREDICTORS
Chibueze Onyemkpa*1, Michael K. McLeod1, Tolulope Oyasiji1,2
1Surgery, Michigan State University, Lansing, MI; 2Barbara Ann Karmanos Cancer Institute at McLaren Flint, Wayne State University, Flint, MI
Introduction
Adenocarcinomas and neuroendocrine tumors (NETs) are two commonly encountered neoplasms of the appendix. Survival data are often needed to address clinical questions in treatment decisions. Appendiceal NETs are a spectrum of pathologic entities with varying biology. We sought to establish data to compare the survival profile of these tumors and determine predictors of survival.
Methods
A retrospective analysis of all cases of appendiceal adenocarcinoma and NETs in the Surveillance, Epidemiology, and End Results (SEER) database from 2010 to 2013, for which American Joint Committee on Cancer (AJCC) 7th edition staging was available. We defined three groups for Appendiceal NETs - I (carcinoids), II (adenocarcinoids, goblet cell carcinoids and atypical carcinoids) and III (neuroendocrine carcinomas). Kaplan- Meier survival analysis was used to determine Overall Survival (OS) and Disease Specific Survival (DSS) while Cox proportional hazards models were used to determine predictors of OS and DSS.
Results
A total of 1,672 adenocarcinoma and 980 NET cases were analyzed. For NET cases- I (290 cases), II (372 cases) and III (318 cases). OS for appendiceal adenocarcinomas were 87%, 72% and 65% at 1-, 2- and 3-years while the disease specific survival were 90%, 76% and 69% respectively.
NET- I had OS of 97%, 96% and 96% at 1-, 2- and 3-years and DSS of 99% at 1-, 2- and 3- years respectively. NET- II had OS of 95%, 90% and 85% at 1-, 2- and 3-years and DSS of 98%, 93% and 88% at 1-, 2- and 3- years respectively. NET- III had OS of 93%, 82% and 80% at 1-, 2- and 3-years and DSS of 95%, 88% and 85% at 1-, 2- and 3- years respectively.
Poorer OS and DSS were associated with advanced AJCC stages (p <0.001) for carcinomas and NETs. No significant differences in OS and DSS were observed for the different stages of NETs - I (p values 0.378 and 0.336 respectively). Age at diagnosis and advanced AJCC Stage were negative predictors of OS and DSS for adenocarcinoma and appendiceal NETs.
Conclusions
This data suggests that appendiceal adenocarcinoma carries worse OS and DSS profile compared to appendiceal NET. It also demonstrates that histologic classification of appendiceal NET, based on biology, correlates with survival profile. While neuroendocrine carcinoma has the poorest survival profile among appendiceal NET, it is slightly better than that of appendiceal adenocarcinoma.
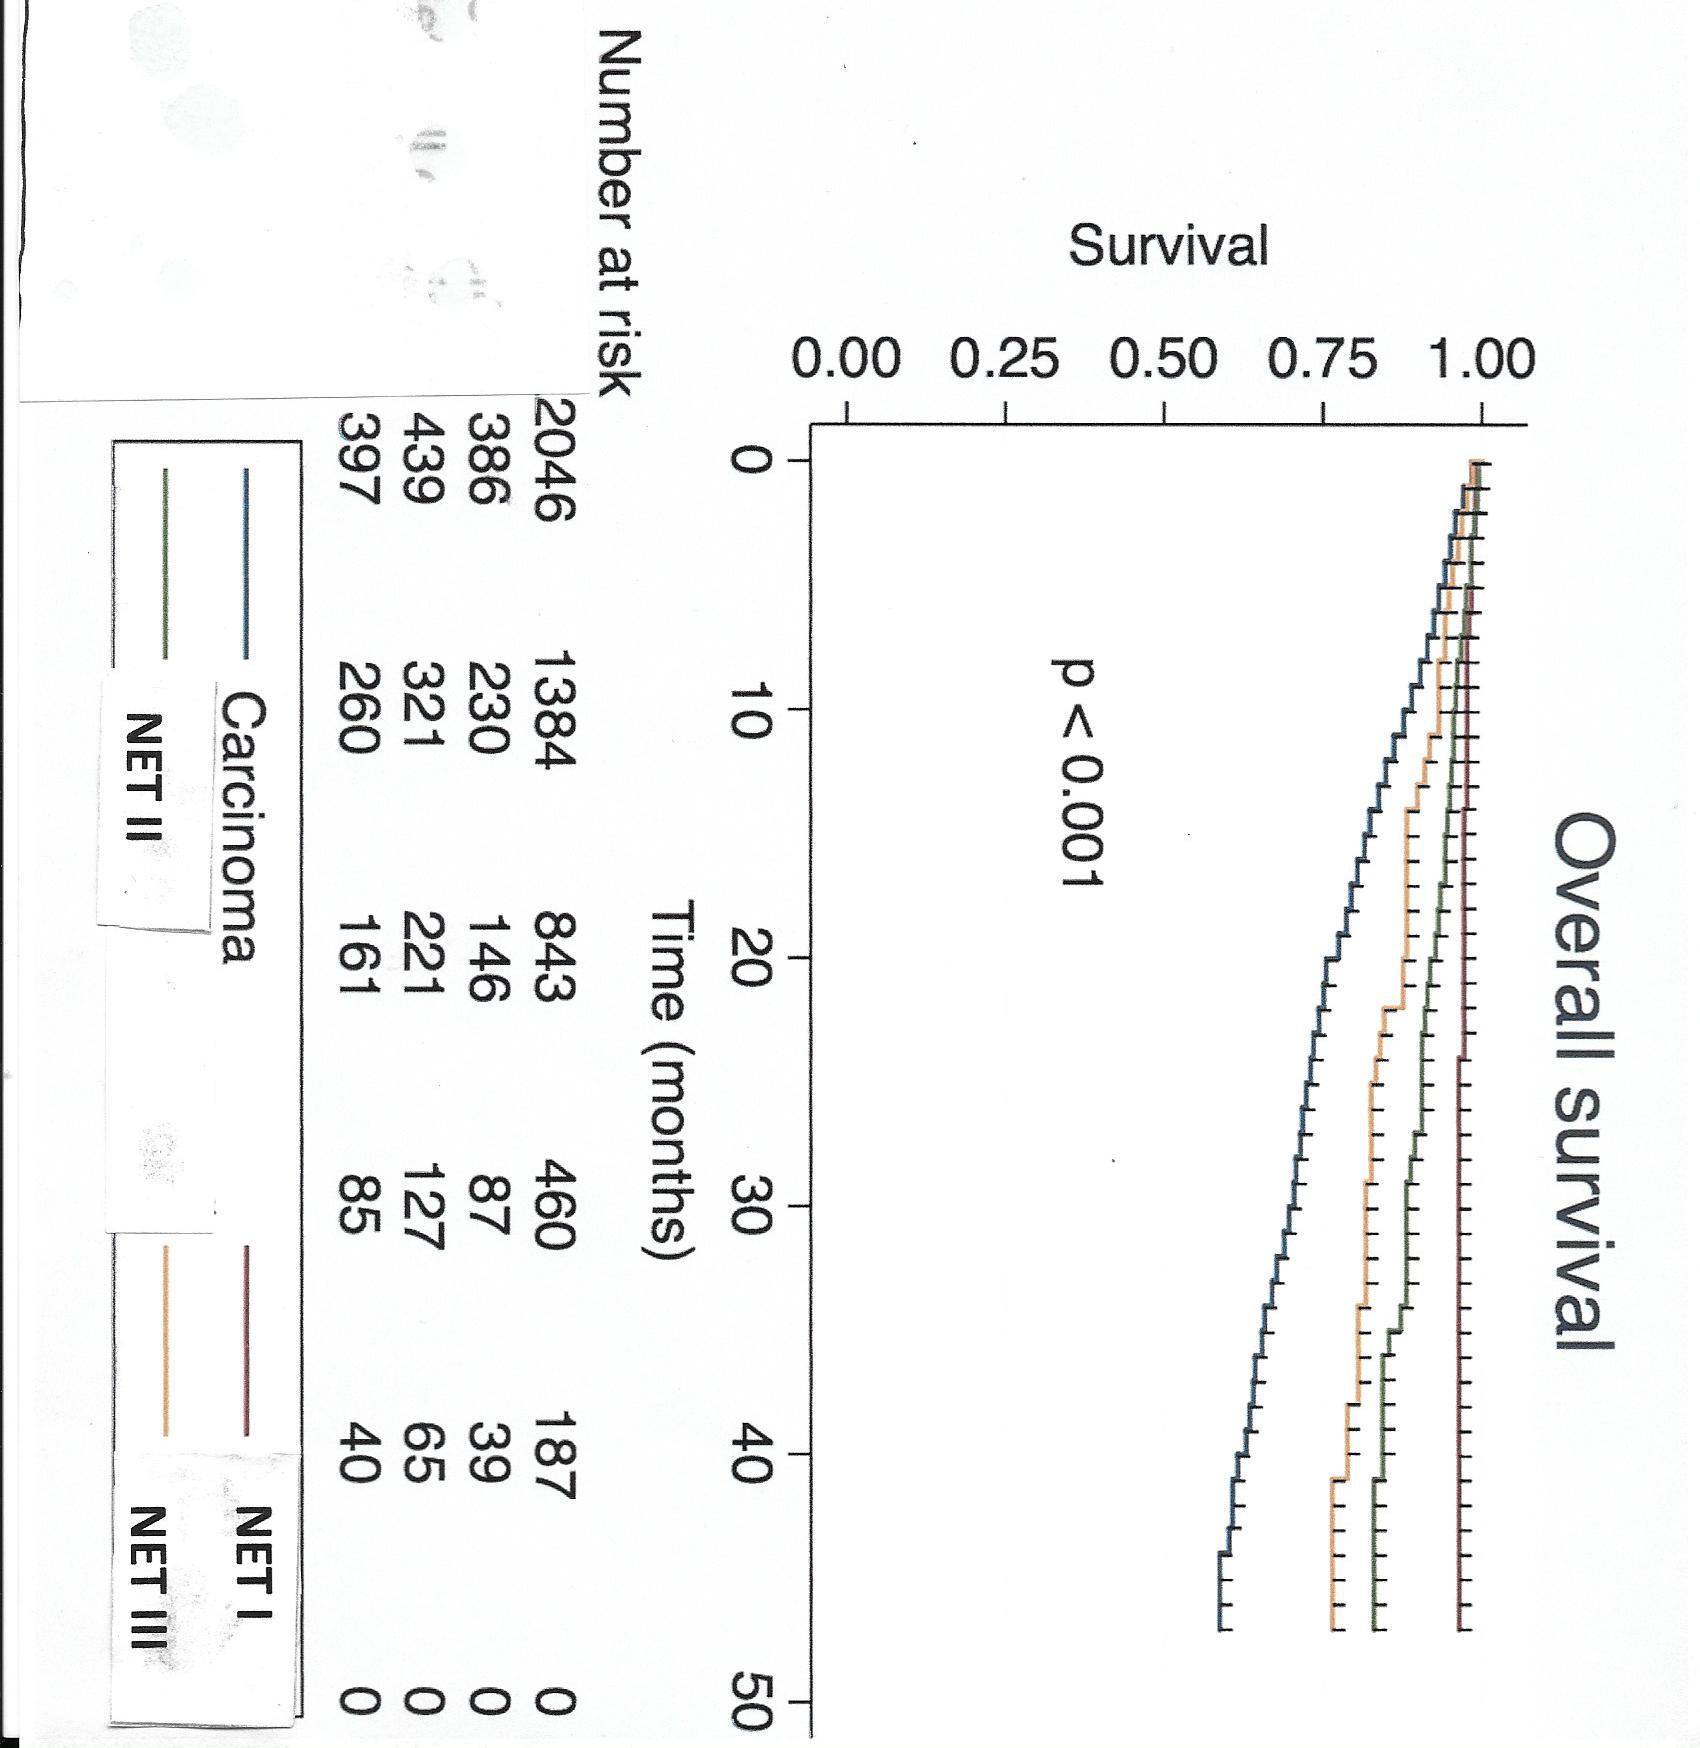
Overall Survival curve for Appendiceal Tumors.
Back to 2017 Program and Abstracts
|

