|
Back to 2017 Program and Abstracts
OPTIMAL THERAPY IN LOCALLY ADVANCED ESOPHAGEAL CANCER: A NATIONAL CANCER DATABASE ANALYSIS
William M. Whited*, Jaimin Trivedi, Victor van Berkel, Matthew Fox
Department of Cardiovascular and Thoracic Surgery, University of Louisville, Louisville, KY
Background
There are over 12,000 new cases of esophageal cancer annually in the United States. Diagnosis of esophageal cancer often occurs in advance stages, resulting in an overall 5-year survival around 15%. For patients with locally advanced disease and no evidence of metastasis (stage II and III), neoadjuvant therapy followed by a R0 (negative margin) resection, results in the greatest chance for cure. Not all patients will progress through and complete this treatment regimen. The goal of this study is to explore what patient factors and treatment variables affect patient’s progression through the optimal treatment regimen.
Methods
The National Cancer Database (NCDB) was queried for patients diagnosed with esophageal cancer between 2004 and 2014 (n=129296). Patients with locally advanced disease, with no evidence of metastasis (stage II and III) were included in the analysis. Patients with cT2N0 were excluded from analysis due to a significant portion of this group receiving surgery alone. Patients with unknown cancer staging and treatment information were excluded from the final analysis. Patients were then classified into four groups based on how far they progressed with the optimal treatment algorithm. Group 1 did not receive any treatment. Group 2 received chemotherapy or chemoradiation, but did not receive surgery. Group 3 received neoadjuvant chemotherapy or chemoradiation and underwent non R0 resection. Group 4 received neoadjuvant chemotherapy or chemoradiation and underwent R0 resection. Overall survival for each group was calculated using Kaplan-Meier survival curve.
Results
There were 33747 patients with locally advanced clinical stage II (39%) and III (61%) esophageal cancers during the study period (mean age=65.8 +/- 11.1 years, 79% Males). Of all the patients 36% had private insurance, 68% had median household income > $35000 and 44% were treated at academic centers. 8% patients did not receive any treatment, 54% received chemotherapy or chemoradiation but no surgery, 4% received neoadjuvant therapy and non R0 surgical resection, 34% received neoadjuvant therapy and R0 surgical resection. Table 1 demonstrates intergroup differences. The 1, 3, and 5 year survival in group 4 was 83%, 50%, and 37% respectively which was significantly better compared to group 1 (24%, 9%, 5%), group 2 (58%, 25%, 17%), and group 3 (73%,34%, 23%)(Figure 1). Patients in group 4 were more likely to be Caucasian, have private insurance, and have adenocarcinoma.
Conclusion
Neoadjuvant therapy follow by a R0 resection is the optimal treatment in patients with locally advanced esophageal cancer (Group 4). Although 92% of locally advanced esophageal cancer patients received chemotherapy or chemoradiation, only 38% patients received surgery after receiving neoadjuvant therapy. Socioeconomical and demographic factors may have some impact on reception of optimal therapy.
Table 1. Treatment Variables and Patient Characteristics by Group
| | Group 1 | Group 2 | Group 3 | Group 4 | p-value | | N | 2542 | 18018 | 1186 | 11093 | | | Age (mean) | 71.2 � 12.1 | 67.0 � 10.8 | 61.2 � 9.6 | 61.8 � 9.4 | <0.001 | | Caucasian | 2055 (81%) | 15218 (85%) | 1084 (91%) | 10366 (93%) | <0.001 | | African American | 352 (14%) | 2102 (12%) | 64 (5%) | 402 (4%) | | Male | 1825 (72%) | 13853 (77%) | 997 (84%) | 9402 (84%) | <0.001 | | Household Income > $35000 | 64% | 66% | 72% | 73% | <0.001 | | Private Insurance | 548 (22%) | 5084 (28%) | 554 (47%) | 5639 (50%) | <0.001 | | Medicare | 1616 (64%) | 9726 (54%) | 426 (36%) | 4292 (38%) | | Medicaid | 187 (7%) | 1392 (8%) | 69 (6%) | 563 (5%) | | Academic Facility | 1030 (41%) | 6822 (38%) | 542 (47%) | 6003 (55%) | <0.001 | | Distance from Treatment Center in Miles (median) | 9.4 | 9.6 | 15.1 | 17.1 | <0.001 | | Metro Area | 1965 (81%) | 13839 (81%) | 885 (79%) | 8336 (77%) | 0.01 | | Education Level: County with > 21% non high school graduates (2008-2012) | 520 (21%) | 3082 (17%) | 152 (13%) | 1277 (12%) | <0.001 | | Charleson-Dayo Score ≥ 2 | 223 (9%) | 1107 (6%) | 41 (3%) | 599 (5%) | <0.001 | | __________ | ___________ | ____________ | __________ | ____________ | __________ | | Stage II | 1038 (41%) | 6736 (37%) | 444 (37%) | 4553 (41%) | <0.001 | | Stage III | 1504 (59%) | 11282 (63%) | 742 (63%) | 6540 (59%) | | Adenocarcinoma | 48% | 51% | 68% | 73% | <0.001 | | Radiation | 0% | 15391 (88%) | 1017 (86%) | 10259 (91%) | <0.001 |
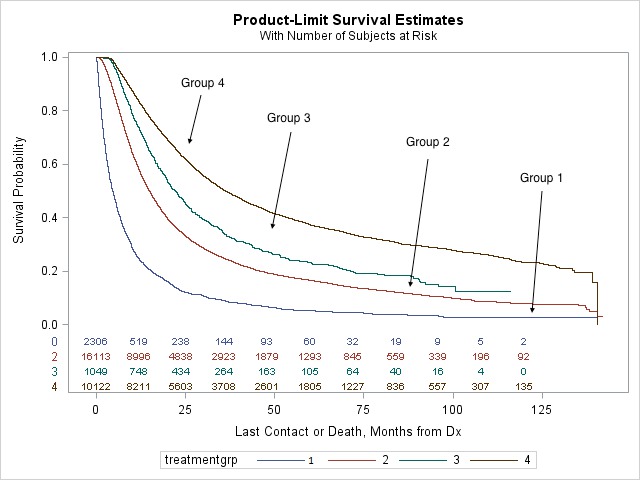 Figure 1. Kaplan-Meier Survival Curve by Group
Back to 2017 Program and Abstracts
|

