|
Back to 2015 Annual Meeting Program
Quality of Life and Alimentary Satisfaction After Gastrectomy Versus Esophagectomy
Katrin Schwameis*2, Joerg Zehetner2, Geoffrey RO2, Katherine Ross2, Joshua a. Boys1, Daniel S. OH1, Jeffrey a. Hagen1, John Lipham2, Steven R. Demeester1
1Thoracic Surgery, Keck Medicine, USC, Los Angeles, CA; 2Surgery, Keck Medicine of USC, Los Angeles, CA
Introduction: Tumors at the gastroesophageal junction can be treated by gastrectomy or esophagectomy. Oncologic outcomes are reported to be similar, therefore the aim of this study was to evaluate quality of life (QOL) and alimentary satisfaction after gastrectomy versus esophagectomy.
Methods: A retrospective chart review was performed of patients that had gastrectomy with Roux-en-Y esophagojejunostomy or esophagectomy with gastric pull-up from 2000-2014. Symptoms, alimentary satisfaction and QOL were assessed by telephone interview and questionnaires (RAND 36-item Short Form Health Survey [SF-36], Gastrointestinal Quality of Life Index [GIQLI], and the Alimentary Satisfaction [AS] Score). In each questionnaire higher scores denote better satisfaction. Follow-up was divided into early (≤ 2years), medium (>2-5 years) and long (>5 years). Patients that could not be contacted or who refused to participate were excluded.
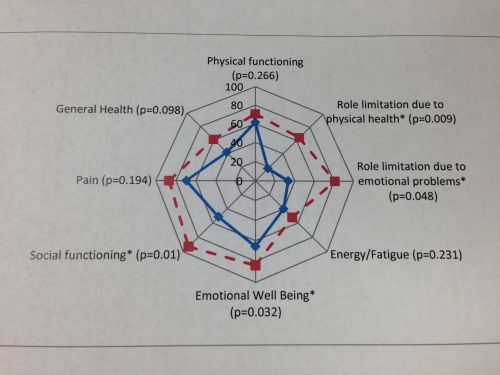
Results: There were 20 patients in each group (table). There were no significant differences between groups for age, gender, initial BMI, or BMI at follow-up. All but 3 patients lost weight after gastrectomy and all lost weight after esophagectomy. The median weight loss after gastrectomy was 14 and after esophagectomy was 11.6 pounds. The mean number of meals a day (3) was similar between groups. There were no significant differences in symptoms but more patients used proton pump inhibitors after esophagectomy. Overall, QOL by SF-36 was similar between groups in all but the category role limitation due to physical health which was higher after esophagectomy. However, at early follow-up QOL was better after esophagectomy (Figure). There was no significant difference in the overall scores for GIQLI (97 after gastrectomy versus 101 after esophagectomy, p=0.685) and AS (7.5 in each group, p=0.926), but GIQLI scores were significantly higher at early follow-up after esophagectomy (78.7 for gastrectomy versus 105.6 for esophagectomy, p=0.014). The SF-36 scores were similar between males and females after gastrectomy, but after esophagectomy scores in the categories for general health and physical function were significantly better in females (71.7 and 88.3 for females respectively versus 48.9 and 63.2 for males, p=0.043 and p=0.008). Comparing GIQOL and AS scores by gender, females tended to have higher scores for both questionnaires after a gastrectomy (100 and 8 for females respectively versus 95.4 and 7.2 for males) and an esophagectomy (116 and 9.1 for females versus 94 and 6.8 for males).
Conclusions: Overall QOL and alimentary satisfaction were similar after gastrectomy and esophagectomy, but in the first two years the scores for both SF-36 and the GIQLI questionnaires were better after an esophagectomy. Satisfaction was similar by gender, but females tended to score higher than males after both procedures.
Demographic and clinical data.
| Gastrectomy
n=20 | Esophagectomy
n=20 | p-value | | Mean Age in years (range) | 67.6 (41.6-87.7) | 66.7 (42-83) | 0.803 | | Gender: m/f | 12/8 | 14/6 | 0.741 | | Mean F/U time in months (range) | 37.5 (4.3-115.5) | 44 (7.2-127.5) | 0.541 | | Early F/U: n (%) | 7 (35) | 7 (35) | 0.723 | | Medium F/U: n (%) | 9 (45) | 7 (35) | 0.723 | | Long F/U: n (%) | 4 (20) | 6 (30) | 0.723 | | BMI initial | 29.45 (17.2-49.5) | 28.2 (21.5-42.4) | 0.624 | | BMI at follow up | 24.3 (17.4--50.4) | 23.8 (16.2-35.3) | 0.777 | | Neoadjuvant Chemotherapy: n (%) | 8 (40) | 8 (40) | 0.487 | | Mean number of meals (range) | 3 (1.5-5) | 3 (2-7) | 1 | | Dysphagia: n (%) | 4 (20) | 4 (20) | 1 | | Heartburn: n (%) | 3 (15) | 2 (10) | 1 | | Regurgitation: n (%) | 4 (20) | 5 (25) | 1 | | Aspiration: n | 0 | 0 | N/A | | PPI use: n (%) | 2 (10%) | 10 (50) | 0.031 | | Dumping: n (%) | 0 | 1 (5) | 1 | | Diarrhea: n (%) | 5 (25) | 1 (5) | 0.195 |

Back to 2015 Annual Meeting Program
|


