|
 |
Back to 2015 Annual Meeting Program
a Randomized Controlled Trial of Six Weeks of Home Enteral Nutrition Versus Standard Care After Esophagectomy or Total Gastrectomy for Cancer: Report on a Pilot and Feasibility Study
David Bowrey*1, Melanie L. Baker1, Vanessa Halliday2, Anne Thomas3, Karen Smith4, Tom Morris5, Ruth Pulikottil-Jacob6, Arne Ring5
1Surgery, University Hospitals of Leicester NHS Trust, Leicester, United Kingdom; 2Health Sciences, University of Sheffield, Sheffield, United Kingdom; 3Cancer Studies, University of Leicester, Leicester, United Kingdom; 4Research Design Service, University of Leicester, Leicester, United Kingdom; 5Clinical Trials Unit (Statistics), University of Leicester, Leicester, United Kingdom; 6Health Economics, University of Warwick, Warwick, United Kingdom
Background: Poor nutrition in the first months after esophagogastric resection may be one of the contributing factors to the reduced quality of life (QOL) seen in these patients. The aim of this pilot study was to ascertain the feasibility and potential benefit of home enteral nutrition to inform a subsequent multi-center randomized controlled trial.
Methods: Patients undergoing esophagectomy or total gastrectomy were randomized to either a planned program of 6 weeks of home enteral feeding (intervention), or treatment as usual (control). Intervention comprised overnight feeding via jejunostomy to provide 50% of energy & protein requirements, in addition to usual oral intake. Primary outcome measures were recruitment and retention rates at 6 weeks & 6 months. Secondary outcome measures were nutritional intake, nutritional parameters, QOL (all at baseline, hospital discharge, 6 weeks postoperative, 3 and 6 months postoperative) and healthcare costs. Analysis was on an intention-to-treat basis.
Results: 54 of 112 (48%) eligible patients participated in the study over the 20 months (July 2012 - February 2014). Study retention at 6 weeks was 41/54 patients (76%). These patients (intervention 21, control group 20) form the basis of this report. Study retention at 6 months was 36/54 patients, 67% (intervention 16, control group 20). Operations were esophagectomy (32 patients) & total gastrectomy (9 patients).
Seventeen of the 20 participants (85%) in the intervention group received treatment as planned, receiving a mean 1300 kcal energy & 51g protein daily as enteral supplement. Eight of the 21 participants (38%) in the control group required home enteral feeding (2 planned, 6 restarted for nutritional failure).
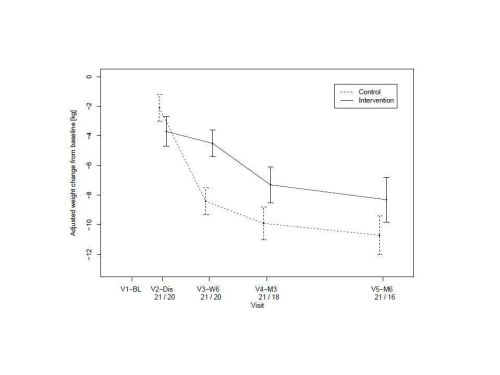
At 6 weeks post discharge from hospital, >5% weight loss from baseline was observed in 16/20 (80%) participants in the control arm & 4/20 (20%) participants 20%) in the intervention arm. No participant (0%) in the intervention arm experienced >10% weight loss, while this was seen in 8/20 (40%) participants in the control arm.
At 6 weeks, there was better weight preservation in the intervention compared to the control group (Figure). Triceps skin fold thickness (as a measure of nutrition) and QOL measures are indicated (Table). The economic evaluation suggested that the health service costs associated with home enteral nutrition were slightly less than usual treatment. The mean cost per patient in the intervention arm was £3,445 (\) and in the control arm was £3,512 (\).
Conclusions: This pilot and feasibility study of home enteral feeding after esophagogastric resection demonstrated early nutritional advantages in favor of home feeding. Further, with a recruitment rate of 48% and retention at six months of 67%, we consider that a large scale multi-center study, required to evaluate this intervention should be feasible.
| 6 weeks post discharge | 3 months postoperative | 6 months postoperative | | Triceps skin fold thickness (mm) | | | | | Intervention | -0.6 | -1.0 | -1.6 | | Control | -1.5 | -2.1 | -2.1 | | 95% CI for difference | -0.9 (-2.1, 0.3) | -1.2 (-2.3, 0) | -0.5 (-1.7, 0.8) | | | | | | Global QOL (EORTC C30) | | | | | Intervention | -20 | -24 | -11 | | Control | -16 | -22 | -7 | | 95% CI for difference | 5 (-9, 18) | 2 (-4, 13) | 3 (-9, 16) | | | | | | Disease specific QOL (EORTC OG25) | | | | | Intervention | -11 | -8 | -2 | | Control | 0 | -4 | 0 | | 95% CI for difference | 10 (2, 19) | 5 (-4, 13) | 2 (-6, 10) | | | | | | QOL (EQ-5D) | | | | | Intervention | 0.60 | not assessed | 0.69 | | Control | 0.64 | not assessed | 0.73 | | 95% CI for difference | 0.04 (-0.12, 0.20) | not assessed | 0.03 (-0.11, 0.16) |

Back to 2015 Annual Meeting Program
|


