
|
|
Back to 2015 Annual Meeting Program
Colorectal Resection for Hereditary Syndromes: Missed Opportunities?
Lindsay a. Bliss*1, Mariam F. Eskander1, Susanna W. Degeus1, Sing Chau NG1, Mandeep Sawhney2, Rebecca Miksad3, Deborah Nagle1, Jennifer F. Tseng1
1Surgical Outcomes Analysis & Research, Beth Israel Deaconess Medical Center, Boston, MA; 2Division of Gastroenterology, Beth Israel Deaconess Medical Center, Boston, MA; 3Division of Hematology/Oncology, Beth Israel Deaconess Medical Center, Boston, MA
Background: Hereditary syndromes and familial cancers represent a small proportion of colorectal cancers. The national rate of colorectal resections performed in predisposed patients is unknown. This study investigated colorectal resections performed in patients with documented potential genetic predispositions compared to others.
Methods: All colorectal resections in Nationwide Inpatient Sample (NIS) 2004-2011 were retrospectively reviewed. Patients were identified using ICD-9 procedures. Cohorts were generated by codes for genetic predisposition to colorectal cancer, including family history of genetic disease carrier or malignant neoplasm of the gastrointestinal tract, breast or ovary, and personal diagnosis of Peutz-Jeghers, Sturge-Weber, or von Hippel Lindau. Univariate analyses comparing groups based on sociodemographic factors and outcomes were performed by chi-square. Cochran-Armitage test was used for trends. Age, length of stay, and costs were analyzed by univariate linear regression.
Results: Among 2,469,494 colorectal resections, 2.4% (60,026 patients) had documented potential genetic predisposition. Documentation of potential genetic cancer predisposition more than doubled over the time-course of the study [Table]. Predisposed patients were more likely to be younger, female, white, higher ZIP income, privately insured, healthier and more likely to undergo elective resection (all p<0.0001). Median age was 60 [51,70] compared to 65 [53,76] in non-genetic patients [Figure]. Those with genetic predisposition were more likely to have a cancer diagnosis or personal history of cancer (82.0% vs. 56.9%, p<0.0001) and receive laparoscopic resection (18.1% vs. 10.1%, p<0.0001). Those with genetic predispositions to malignancy experienced shorter stays (median 6 vs. 7 days, p<0.0001), were more likely to be discharged to home (94.6% vs. 79.1%, p<0.0001), and were less likely to experience complications (16.9% vs. 32.8%, p<0.0001).
Conclusions: Resections among patients with documented potential genetic predispositions to colorectal malignancies are increasing, possibly due to increased screening allowing detection at earlier stages when surgery is possible and/or documentation and genetics evaluation referral. Given the relatively high age of potentially predisposed patients (60, compared with 65 for non-genetic peers), earlier screening and intervention among those at known risk may be warranted. In addition, patients with higher socioeconomic status are more represented in documented potentially predisposed resected patients, suggesting that lower socioeconomic status patients may not be assessed or followed as frequently for possible genetic/familial syndromes. Ensuring adequate screening for hereditary colorectal cancer syndromes across all sociodemographic groups at appropriately early ages may improve outcomes for these treatable conditions.
Patient Characteristics by Genetic Status
| No Documented Potential Genetic Predisposition | Documented Potential Genetic Predisposition | | n | % | n | % | | Female | 1,285,022 | 53.3% | 35,069 | 58.4% | | Age (median, IQR) | 65 | [53,76] | 60 | [51,70] | | Race | White | 1,535,723 | 63.7% | 42,526 | 70.8% | | Black | 177,714 | 7.4% | 3,915 | 6.5% | | Hispanic | 130,664 | 5.4% | 2,698 | 4.5% | | Other/MIssing | 565,367 | 23.5% | 10,887 | 18.2% | | ZIP Median Income Quartile | 0-25th | 563,803 | 23.4% | 12,196 | 20.3% | | 26th-50th | 622,198 | 25.8% | 15,154 | 25.2% | | 51st-75th | 615,902 | 25.6% | 15,548 | 25.9% | | 76th-100th | 607,433 | 25.2% | 17,128 | 28.5% | | Payer | Medicare | 1,198,972 | 49.8% | 21,858 | 36.4% | | Medicaid | 125,536 | 5.2% | 2,389 | 4.0% | | Private | 943,196 | 39.1% | 32,265 | 53.8% | | Elixhauser Score | 0 | 465,117 | 19.3% | 14,170 | 23.6% | | 1 | 583,122 | 24.2% | 16,970 | 28.3% | | 2 | 533,759 | 22.2% | 13,420 | 22.4% | | ≥3 | 827,469 | 34.3% | 15,466 | 25.8% | | Elective | 1,401,662 | 58.2% | 45,738 | 76.2% | | Year | 2004 | 297,024 | 12.3% | 4,521 | 7.5% | | 2005 | 300,064 | 12.5% | 5,438 | 9.1% | | 2006 | 300,233 | 12.5% | 5,568 | 9.3% | | 2007 | 303,634 | 12.6% | 8,044 | 13.4% | | 2008 | 318,432 | 13.2% | 7,610 | 12.7% | | 2009 | 296,783 | 12.3% | 8,651 | 14.4% | | 2010 | 288,933 | 12.0% | 10,037 | 16.7% | | 2011 | 304,365 | 12.6% | 10,156 | 16.9% | | Total | 2,409,468 | 97.6% | 60,026 | 2.4% |
All p<0.0001 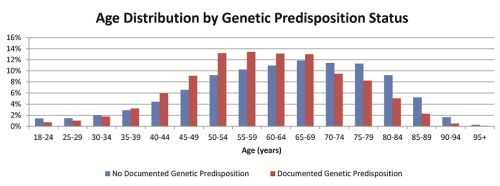
Back to 2015 Annual Meeting Program
|

