
|
|
Back to 2015 Annual Meeting Program
Race and Gastric Cancer Outcomes: Not Black and White
Mariam F. Eskander*1, Lindsay a. Bliss1, Susanna W. Degeus1, George Baison1, Tyler M. Berzin2, Sing Chau NG1, Jennifer F. Tseng1
1Surgery, Beth Israel Deaconess Medical Center, Boston, MA; 2Gastroenterology, Beth Israel Deaconess Medical Center, Boston, MA
Background: Race has been linked to several outcomes for gastric cancer including survival, timing of diagnosis, and rates of treatment, yet it is unknown how the effects of race vary based on insurance status, class and gender.
Methods: We used the Nationwide Inpatient Sample (NIS) to examine the relationship between race and inpatient death among all discharges with any diagnosis code for malignant gastric neoplasm between 2004 and 2011. Race was reported as white, black, Hispanic, Asian/Pacific Islander, and other. Baseline demographics were compared; for chi-square testing, patients were dichotomized to (non-Hispanic) white and non-white. A multivariate logistic regression model for inpatient death using the individual race categories was created; stratified analyses were carried out by median household income, insurance status, and gender. A sensitivity analysis was performed on admissions for gastric resection. Survey weighting was used for all analyses.
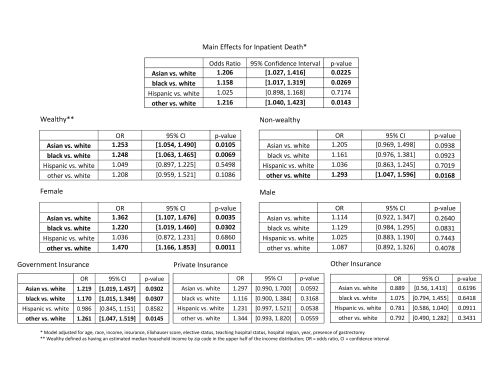
Results: Of 296,417 weighted hospital discharges for patients with gastric cancer, 40% were for non-whites. A greater proportion of non-whites were females and under 50 years of age (both p<0.0001), compared to whites [Table.] Non-whites with incomes below the 25th percentile had more admissions than white patients (36.2% vs. 20%, p<0.0001), and accordingly had more admissions covered by Medicaid (20% vs. 5.4%, p<0.0001). They also had more non-elective admissions (72% vs. 65.3%, p<0.0001) and higher rates of inpatient death (9% vs. 8.2%, p=0.0086). On multivariate analysis, there was an increased odds of inpatient death for Asians/Pacific Islanders (OR 1.206, p=0.0225), blacks (OR 1.158, p=.0269), and patients of other race (OR 1.216, p=0.0143) vs. white patients. However, income, insurance status, and gender were effect modifiers of these relationships. Being Asian/Pacific Islander or black was no longer a predictor of increased odds of inpatient death for non-wealthy patients, but remained significant for wealthy patients (> 50th percentile zip median income.) Similarly, black, Asian/Pacific Islander, and other race were not significant predictors of inpatient death in patients with private or other insurance or in male patients, but did predict an increased odds of death in government-insured patients and females. [Figure] Race was not a significant predictor of inpatient death in patients receiving gastric resections, although non-white race appeared to be protective.
Conclusions: Race is a significant predictor of increased odds of inpatient death for all admissions among gastric cancer patients. Nevertheless, these effects do not appear homogenous and should be reported and interpreted separately for unique sociodemographic groups.
Patient and Hospital Characteristics
| Non-Hispanic white | Non-white | p-value | | 176,602 | 119,815 | | n | % | n | % | | Sex | Male | 116,428 | 65.9 | 70,664 | 59.0 | <0.0001 | | Female | 60,175 | 34.1 | 49,152 | 41.0 | | Age | < 50 | 16,662 | 9.4 | 21,534 | 18.0 | <0.0001 | | 50-64 | 50,275 | 28.5 | 38,237 | 31.9 | | ≥ 65 | 109,666 | 62.1 | 60,044 | 50.1 | | Median Income by Zip Code | ≤ 50th percentile | 78,985 | 44.7 | 69,181 | 57.7 | <0.0001 | | > 50th percentile | 94,080 | 53.3 | 46,042 | 38.4 | | Insurance | Government | 112,580 | 63.7 | 77,005 | 64.3 | <0.0001 | | Private | 56,022 | 31.7 | 31,397 | 26.2 | | Other/Missing | 8,001 | 4.5 | 11,413 | 9.5 | | Elixhauser Score | 0 | 8,556 | 4.8 | 7,199 | 6.0 | 0.0005 | | 1 | 29,331 | 16.6 | 21,201 | 17.7 | | 2 | 41,940 | 23.7 | 27,940 | 23.3 | | ≥ 3 | 96,775 | 54.8 | 63,475 | 53.0 | | Elective Status | Elective | 61,258 | 34.7 | 33,599 | 28.0 | <0.0001 | | Non-elective | 115,344 | 65.3 | 86,216 | 72.0 | | Hospital Teaching Status | Teaching | 92,498 | 52.4 | 71,770 | 59.9 | 0.0005 | | Non-teaching | 84,104 | 47.6 | 48,046 | 40.1 | | Hospital Region | Northeast | 56,772 | 32.1 | 28,629 | 23.9 | <0.0001 | | Midwest | 28,596 | 16.2 | 9,874 | 8.2 | | South | 60,744 | 34.4 | 46,871 | 39.1 | | West | 30,490 | 17.3 | 34,441 | 28.7 | | Gastric Resection | 34,463 | 19.5 | 22,957 | 19.2 | 0.5589 | | Partial | 21,947 | 12.4 | 17,444 | 14.6 | 0.0001 | | Total | 12,602 | 7.1 | 5,570 | 4.6 | <0.0001 | | Inpatient Death | 14,488 | 8.2 | 10,827 | 9.0 | 0.0086 |
Back to 2015 Annual Meeting Program
|

