Back to 2014 Annual Meeting Posters
Mismatch Repair Status, Host Local and Systemic Inflammatory Responses and Survival in Patients With Primary Operable Colorectal Cancer
James H. Park*1, Arfon G. Powell1,2, Campbell S. Roxburgh1, Colin H. Richards1, Paul G. Horgan1, Donald C. Mcmillan1, Joanne Edwards2
1Academic Unit of Surgery, School of Medicine, University of Glasgow, Glasgow, United Kingdom; 2Unit of Experimental Therapeutics, Institute of Cancer Science, University of Glasgow, Glasgow, United Kingdom
Introduction
DNA mismatch repair deficient (MMRd) colorectal cancer (CRC) accounts for approximately 15% of sporadic cases and is characterised by a proximal location, poor differentiation and a conspicuous peritumoural inflammatory infiltrate. MMRd has also been associated with increased survival, potentially due to coordinated, adaptive local immunity. However, although local inflammatory responses have been well defined, other components of the tumour microenvironment and systemic inflammatory responses remain to be investigated.
Objective
In the present study, the relationship between MMRd, local and systemic inflammatory responses and survival was examined in patients undergoing CRC resection.
Methods
228 patients who had undergone elective Stage I-III CRC resection at a single institution (1997-2007) were included. Local inflammatory responses were examined by IHC for mature (CD3), cytotoxic (CD8), regulatory (FOXP3) and memory (CD45R0) T-cells, Immunoscore and Klintrup-Mäkinen (KM) score. Systemic inflammatory responses were examined using modified Glasgow Prognostic Score (mGPS) and neutrophil:lymphocyte ratio (NLR). MMR status was determined on a tissue microarray by IHC for MLH1, MSH2, MSH6 and PMS2.
Results
MMRd was identified in 39 patients (17%). MMRd tumours were proximal (p<0.001), poorly differentiated with less venous invasion (VI) (both p<0.05) [Table I]. MMRd was associated with increased stromal and intraepithelial CD3+, CD8+ and CD45R0+ density and Immunoscore (all p<0.05) but not FOXP3+ density or KM score. MMRd was associated with elevated mGPS (p<0.05) and NLR (p<0.01).
There were 70 cancer deaths over a median follow-up of 115 months (range 59-179 months). MMRd was not associated with cancer-specific survival (CSS) on univariate analysis [Table I]. In contrast, T and N stage, VI, tumour perforation, margin and peritoneal involvement, an infiltrative margin, local and systemic inflammatory responses and tumour stroma percentage (TSP) were associated with CSS on univariate analysis.
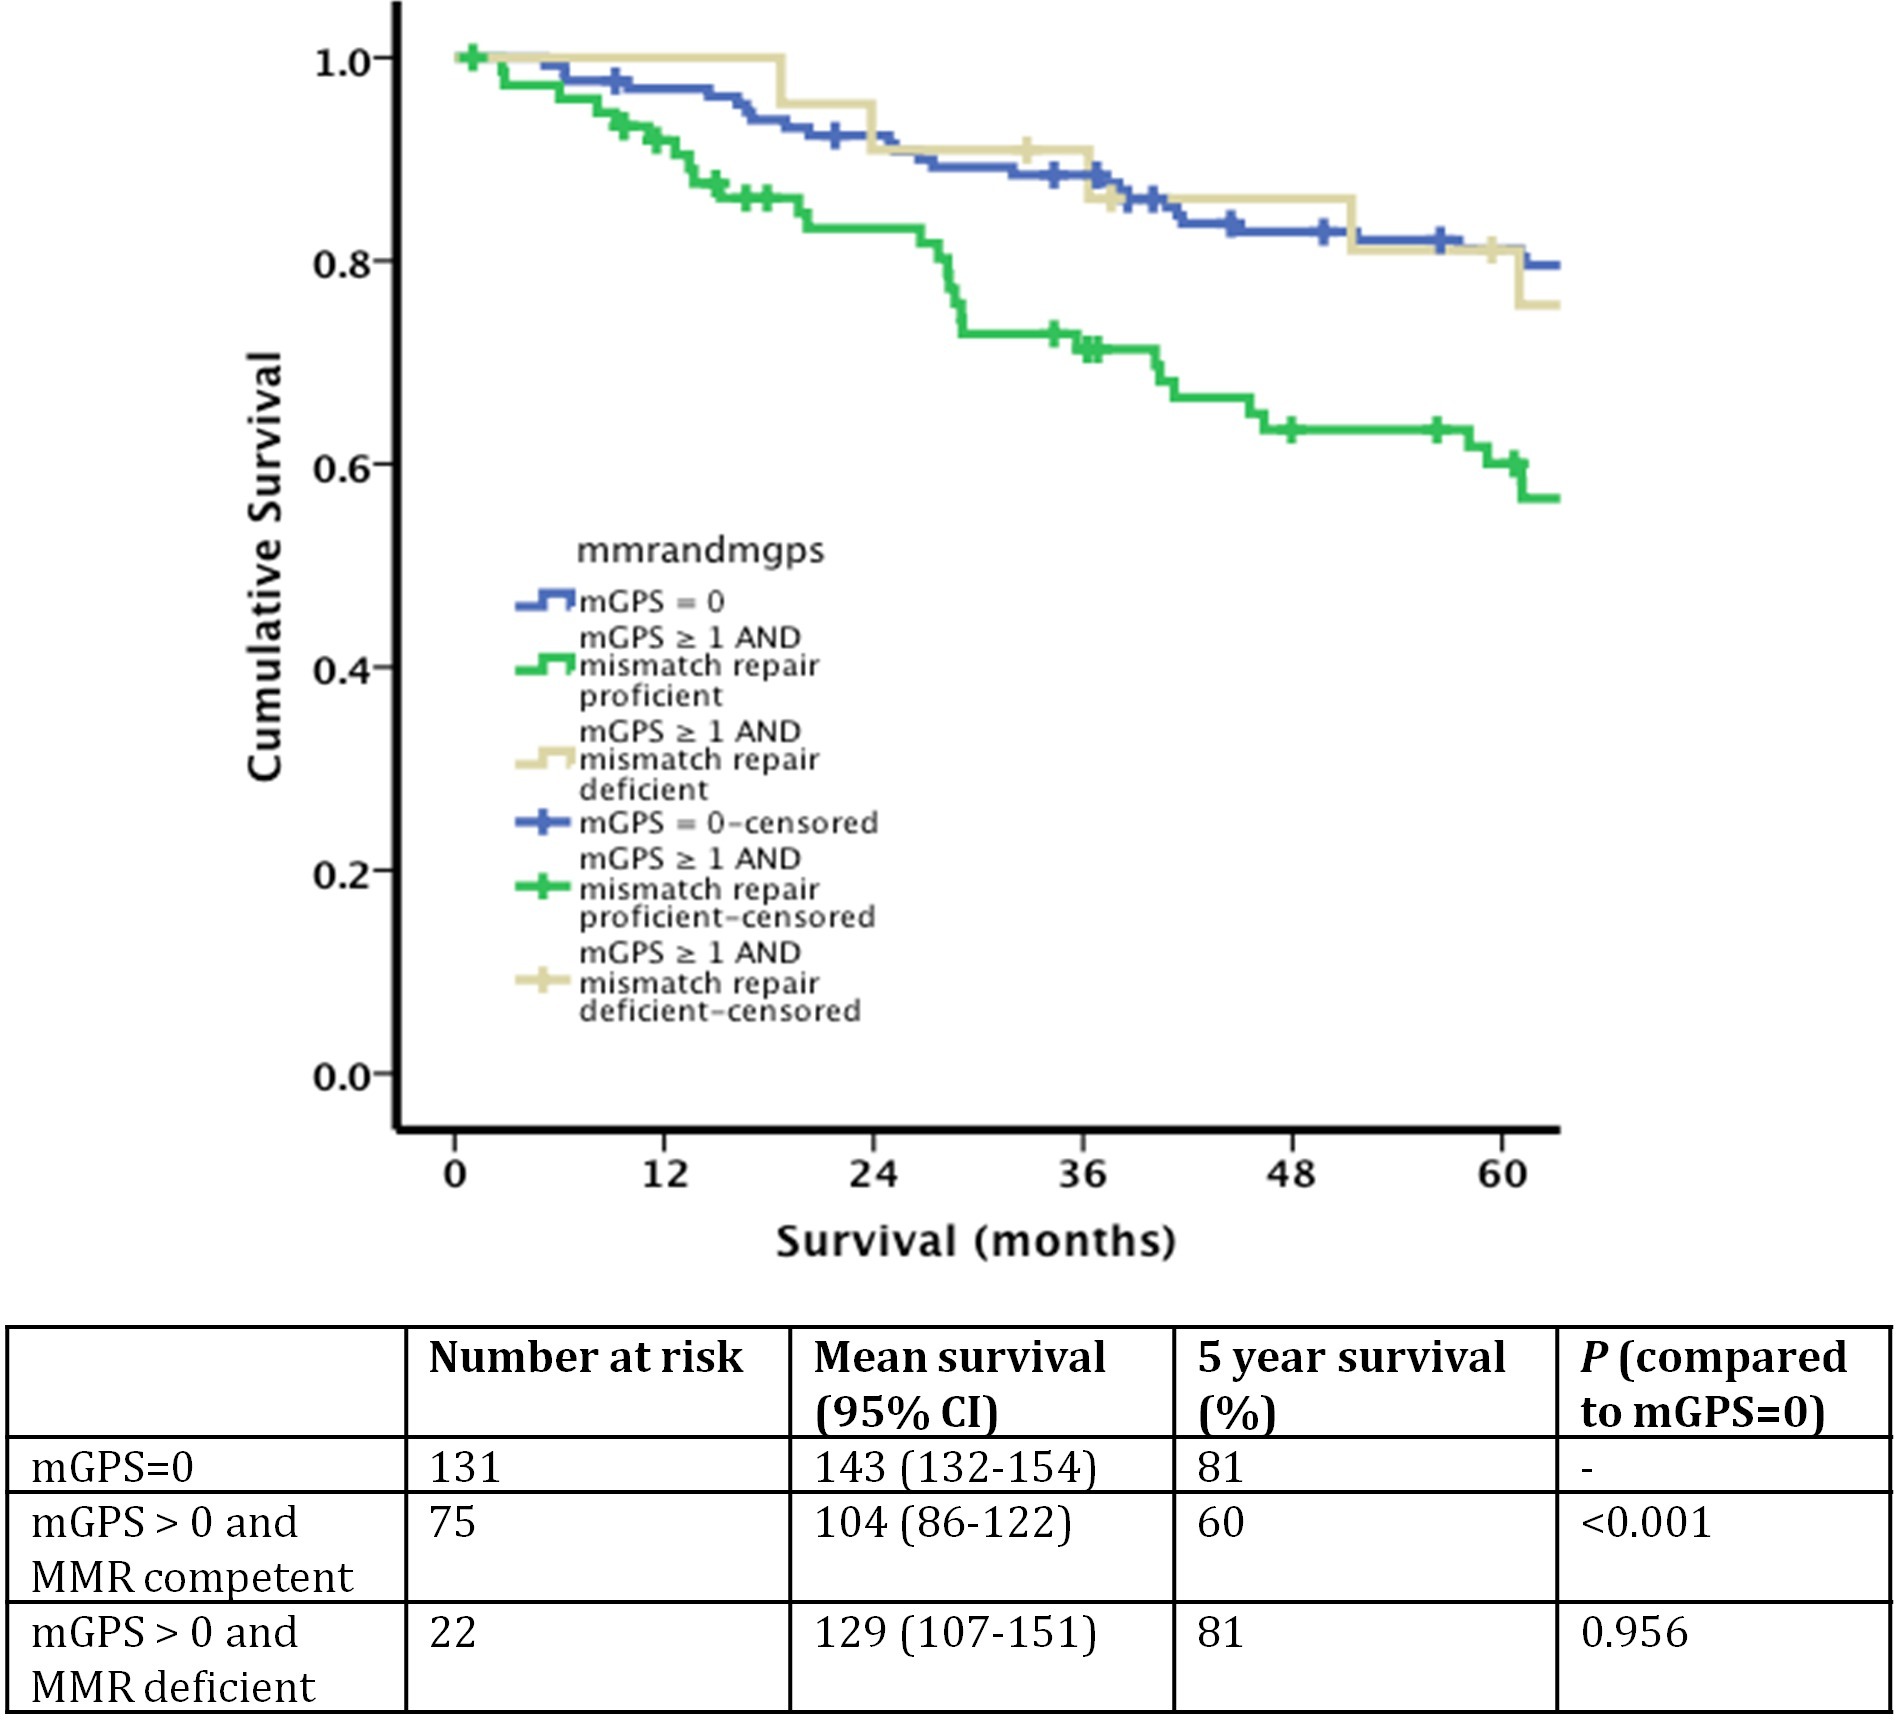
MMRd did not influence the effect of a high TSP or an infiltrative margin on CSS. Furthermore, MRRd was not associated with improved CSS in patients with low Immunoscore or KM score, however was associated with increased CSS in patients with mGPS≥1 (mean CSS: 129 (95% CI 107-151) months vs. 104 (86-122) months, p=0.051) [Figure 1]. MMRd was associated with greater 5-year CSS in patients with mGPS≥1 (81%, vs. 60%), identical to patients with mGPS=0
Conclusion
MMRd was not associated with survival independent of coordinated, adaptive local immunity. Of interest however, despite being associated with innate systemic immune responses, MMRd appeared to protect against the adverse impact of systemic inflammation on survival. The present results suggest a more complex relationship between MMRd and host anti-tumour immunity than previously suspected.
Table I. The relationship between Mismatch repair (MMR) status, clinicopathological characteristics, and survival in patients undergoing elective curative colorectal cancer resection
| MMR intact (n=189) | MMR eficient (n=39) | P* | Cancer-specific survival †<//sup> | P |
| Tumour site (right/ left/ rectum) | 62 (33) / 55 (29) / 72 (38) | 25 (64) / 9 (23) / 5 (13) | <0.001 | 1.04 (0.79-1.38) | 0.770 |
| T stage (1/ 2/ 3/ 4) | 7 (4) / 14 (7) / 121 (64) / 47 (25) | 1 (3) / 3 (8) / 20 (51) / 15 (38) | 0.197 | 1.65 (1.12-2.43) | 0.011 |
| N stage (0/ 1/ 2) | 101 (54) / 65 (34) / 23 (12) | 26 (67) / 12 (31) / 1 (2) | 0.056 | 1.84 (1.34-2.52) | <0.001 |
| Differentiation (mod_well/ poor) | 170 (9) / 19 (10) | 30 (77) / 9 (23) | 0.024 | 1.67 (0.88-3.19) | 0.117 |
| Venous invasion (no/ yes) | 117 (62) / 72 (38) | 31 (80) / 8 (20) | 0.037 | 2.77 (1.72-4.45) | <0.001 |
| Margin involvement (no/ yes) | 178 (94) / 11 (6) | 37 (95) / 2 (5) | 0.866 | 2.63 (1.20-5.75) | 0.016 |
| Peritoneal involvement (no/ yes) | 141 (75) / 48 (25) | 24 (62) / 15 (38) | 0.097 | 2.17 (1.35-3.49) | 0.001 |
| Tumour perforation (no/ yes) | 184 (97) / 5 (3) | 39 (100) / 0 (0) | 0.305 | 8.19 (2.90-23.08) | <0.001 |
| Invasive margin (227)‡ (expansive/ infiltrative) | 103 (55) / 85 (45) | 23 (59) / 16 (41) | 0.633 | 1.75 (1.09-2.80) | 0.021 |
| Tumour necrosis (225) (low grade/ high grade) | 109 (59) / 77 (41) | 23 (59) / 16 (41) | 0.966 | 1.44 (0.90-2.32) | 0.129 |
| Tumour stroma percentage (207) (low/ hig) | 126 (72) / 48 (28) | 28 (85) / 5 (15) | 0.134 | 2.17 (1.30-3.64) | 0.002 |
| Mismatch repair status (intact/ deficient) | - | - | - | 0.63 (0.31-1.27) | 0.198 |
| Immunescore (208) (0/ 1-2/ 3/ 4) | 74 (42) / 58 (33) / 26 (15) / 17 (10) | 9 (26) / 11 (32) / 7 (21) / 7 (21) | 0.024 | 0.54 (0.41-0.70) | <0.001 |
| Klintrup-Makinen grade (weak/ strong) | 127 (68) / 61 (32) | 23 (59) / 16 (41) | 0.304 | 2.49 (1.36-4.55) | 0.003 |
| CD3 (weak/ strong) Margin (215) Stroma (224) Cancer cell nests (224) | 101 (56) / 79 (44) 96 (52) / 89 (48) 130 (70) / 55 (30) | 17 (49) / 18 (51) 11 (28) / 28 (72) 16 (41) / 23 (59) | 0.413 0.007 0.001 | - | - |
| CD8 (weak/ strong) Margin (216) Stroma (221) Cancer cell nests (222) | 96 (52) / 89 (48) 107 (60) / 72 (40) 139 (76) / 44 (24) | 20 (54) / 17 (46) 22 (58) / 16 (42) 22 (56) / 17 (44) | 0.521 0.009 0.013 | - | - |
| CD45R0 (weak/ strong) Margin (217) Stroma (224) Cancer cell nests (224) | 97 (54) / 82 (46) 90 (49) / 95 (51) 138 (75) / 47 (25) | 15 (40) / 23 (60) 11 (28) / 28 (72) 22 (56) / 17 (44) | 0.100 0.020 0.023 | - | - |
| FOXP3 (weak/ strong) Margin (216) Stroma (220) Cancer cell nests (219) | 101 (57) / 77 (43) 103 (57) / 78 (43) 90 (50) / 91 (50) | 25 (66) / 13 (34) 28 (72) / 11 (28) 20 (53) / 18 (47) | 0.306 0.086 0.745 | - | - |
| CRP (mg/L)φ | 8 (6-18) | 20 (5-40) | 0.021ω | - | - |
| Albumin (g/L) | 40 (37-42) | 37 (34-42) | 0.006 | - | - |
| mGPS (0/ 1/ 2) | 114 (60) / 58 (31) / 17 (9) | 17 (44) / 13 (33) / 9 (23) | 0.011 | 2.49 (1.36-4.55) | 0.003 |
| NLR (199) | 3.3 (2.2-4.6) | 4.4 (3.2-5.8) | 0.005 | - | - |
| NLR (<5/ ≥ 5) (199) | 128 (78) / 36 (22) | 23 (66) / 12 (34) | 0.122 | 0.82 (0.34-1.97) | 0.657 |
|
|
* Chi-square test.
† Univariate cox regression anaylsis.
‡number of patients when incomplete data available.
φ Median value (interquartile range) given.
ω Non-parametric test. mGPS - modified Glasgow Prognostic Score. NLR - neutrophil:lymphocyte ratio
Figure 1. The relationship between modified Glasgow Prognostic Score, mismatch repair status and cancer-specific survival in patients undergoing elective, curative colorectal cancer resection
Back to 2014 Annual Meeting Posters