|
 |
Back to 2014 Annual Meeting Abstracts
The Surgical Apgar Score Predicts Early Postoperative Outcomes in a Veteran Population Undergoing Major Surgery of the Alimentary Tract
Ioannis Hatzaras*1,2, Antonio Masi1,2, Antonio Pinna1,3, Alan S. Rosman4,1, Dena Neihaus1, Steven Cohen1,2, John K. Saunders1,2, Elliot Newman1,2, Russell S. Berman1,2, Thomas H. Gouge1,2, H. Leon Pachter1,2, Marcovalerio Melis1,2
1Surgery, NYHHS VAMC, New York, NY; 2Surgery, NYU School of Medicine, New York, NY; 3Surgery, University of Sassari, Sassari, Italy; 4Medicine, James J. Peters VAMC, Bronx, NY
Background: We have previously validated use of the Surgical Apgar Score (SAS), a 10-point score calculated using limited intra-operative data (blood loss, lowest heart rate, lowest mean arterial pressure) for prediction of postoperative morbidity and mortality in a veteran population undergoing general surgery. Herein, we aim to validate use of the SAS for prediction of early post-operative outcomes in a veteran population undergoing major surgery of the alimentary tract.
Methods: We reviewed VASQIP demographics, comorbidities, type of surgery, and post-operative outcomes data of patients undergoing GI surgery at the NY Harbor VAMC. We categorized patients in 4 distinct groups according to their SAS and descriptive statistics were used to compare the groups' characteristics. Multivariate logistic regression was used to assess the effect of SAS on the study's two end-points: postoperative morbidity and mortality.
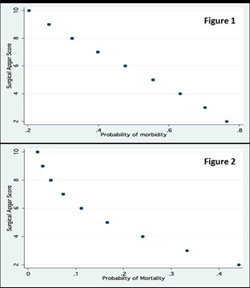
Results: From October 2006 to July 2009, 2125 patients underwent general surgery operations. Of those, 695 patients underwent major operations on the alimentary tract. The subpopulation of the four SAS groups were: SAS≤ 4: 25; SAS 5-6: 163; SAS 7-8: 332; SAS 9-10: 175. Demographics and baseline patient characteristics, type of surgery and post-operative outcomes among the SAS groups are summarized in Table 1. SAS groups did not differ in age, gender and race, however patients with lower SAS had a lower preoperative functional status. By multivariate analysis, low SAS scores were independently associated with increased post-operative morbidity [O.R. 0.81, C.I. (0.72, 0.92), p=0.001, (Figure 1)] and mortality [O.R. 0.78, C.I. (0.64, 0.95), p=0.015, (Figure 2)] , Other independent variables associated with morbidity were: age [(O.R. 1.01, C.I. 1.00, 1.03), P=0.039] and preoperative functional status [O.R. 2.0, C.I. (1.54, 2.61), P<0.001]; the only other independent variable associated with increased mortality was preoperative functional status [O.R. 3.53, C.I. (2.42, 5.15), P<0.001].
Conclusions: The SAS correlates with fixed pre-operative risk (functional status, ASA class) and effectively identifies patients at high risk for post-operative complications following major surgery of the alimentary tract.
Table 1
| Apgar 0-4 N=25 | Apgar 5-6 N=163 | Apgar 7-8 N=332 | Apgar 9-10 N=175 | Total N=695 | P value | | Age (years) | 69.9 ± 2.4 | 69.5 ± 0.9 | 68.0 ± 0.7 | 69.5 ± 0.8 | 68.8 ± 11.8 | 0.41 | | Male Gender | 25 (100%) | 160 (98.1%) | 321 (96.7%) | 173 (98.9%) | 679 (97.7%) | 0.34 | | Race distribution Hispanic Caucasian African-American Other | 3 (14.3%) 8 (38.1%) 9 (42.9%) 1 (4.7%) | 15 (10.5%) 59 (41.3%) 59 (41.3%) 10 (6.9%) | 47 (15.9%) 130 (44.2%) 94 (31.9%) 23 (7.8%) | 15 (9.5%) 67 (42.4%) 58 (36.7%) 18 (11.4%) | 80 (12.9%) 264 (42.9%) 220 (35.7%) 52 (8.4%) | 0.32 | | Functional status Independent Partially Dependent Totally Dependent | 7 (28.0%) 7 (28.0%) 11 (44.0%) | 82 (50.3%) 39 (23.9%) 42 (25.7%) | 247 (74.4%) 54 (16.3%) 31 (9.3%) | 142 (81.1%) 24 (13.7%) 9 (5.1%) | 478 (68.8%) 124 (17.8%) 93 (13.4%) | <0.01 | | Smoking within 1 year prior to surgery | 6 (24.0%) | 45 (27.6%) | 88 (26.5%) | 45 (25.7%) | 184 (26.5%) | 0.97 | | ASA class ASA 2 ASA 3 ASA 4 ASA 5 | 0 7 (28.0%) 17 (68.0%) 1 (4.0%) | 3 (1.8%) 81 (49.7%) 69 (42.3%) 10 (6.1%) | 28 (8.4%) 236 (71.1%) 64 (19.3%) 4 (1.2%) | 28 (11.4%) 136 (77.7%) 19 (10.9%) 0 | 51 (7.3%) 460 (66.2%) 169 (24.3%) 15 (2.2%) | <0.01 | | Site of Surgery Esophagus Stomach Intestine (except rectum) Rectum Liver Biliary Tract Pancreas Peritoneum and Omentum | 0 3 (12.0%) 17 (68.0%) 0 1 (4.0%) 2 (8.0%) 1 (4.0%) 1 (4.0%) | 4 (2.4%) 9 (5.5%) 105 (64.4%) 3 (1.8%) 6 (3.7%) 7 (4.3%) 12 (7.4%) 17 (10.4%) | 13 (3.9%) 21 (6.3%) 189 (56.9%) 15 (4.5%) 20 (6.0%) 19 (5.7%) 23 (6.9%) 32 (9.6%) | 2 (1.1%) 7 (4.0%) 107 (61.1%) 1 (0.6%) 8 (4.6%) 12 (6.9%) 4 (2.3%) 34 (19.4%) | 19 (2.7%) 40 (5.8) 418 (60.1%) 19 (2.7%) 35 (5.0%) 40 (5.8%) 40 (5.8%) 84 (12.1%) | n/a | | Cancer Surgery | 4 (16.0%) | 41 (25.2%) | 105 (31.6%) | 43 (24.6%) | 193 (27.8%) | 0.13 | | Overall morbidity | 13 (52.0%) | 86 (52.8%) | 119 (35.8%) | 41 (23.4%) | 259 (37.3%) | <0.001 | | 30-day mortality | 4 (16.0%) | 25 (15.3%) | 20 (6.0%) | 3 (1.7%) | 52 (7.5%) | <0.001 |

Back to 2014 Annual Meeting Abstracts
|


