|
Back to 2014 Annual Meeting Abstracts
More Art Than Science: Impedance Analysis Prone to Interpretation Error
Thomas Ciecierega*2, Benjamin L. Gordon1, Anna Aronova1, Carl V. Crawford3, Rasa Zarnegar1
1Surgery, Weill Cornell Medical College/New York Presbyterian Hospital, New York, NY; 2Pediatrics, Weill Cornell Medical College/New York Presbyterian Hospital, New York, NY; 3Gastroenterology, Weill Cornell Medical College/New York Presbyterian Hospital, New York, NY
Background: Esophageal pH monitoring is the gold standard for diagnosis of acid reflux, and with the advent of the DeMeester score interpretation can be made with relative ease. However, impedance monitoring to evaluate for all reflux does not have a standardized scale, which can confound interpretation between observers. We aim to determine the inter-observer variability of 24-hour impedance testing interpretations between physicians and computer software.
Methods: Thirty-eight patients that underwent 24-hour impedance monitoring at a tertiary referral center were randomly selected between 2008 and 2013. Two physicians, who routinely use impedance testing, each interpreted raw impedance data generated by the Given Imaging Digitrapper pH-Z Monitoring Test for the same patient cohort. These interpretations were then compared to the computer interpretation of the same cohort. Normalized reflux episode activity (NREA) and reflux symptom association probability were evaluated to determine diagnostic accuracy.
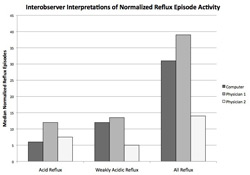
Results: NREA interpretations did not significantly differ between each physician and the computer for Total Acid Reflux (p=0.17) or for Total Nonacid Reflux (p=0.21). However, Physician 2 interpreted the number of Total Weakly Acidic Reflux episodes significantly differently than Physician 1 (p=0.0001) and the computer (p=0.006), whereas Physician 1's interpretations where not significantly different from the computer. In analyzing Total All Reflux episodes, Physician 1 and Physician 2 significantly differed from each other (p=0.008) but did not differ when compared to the computer. The variability in analysis of NREA lead to a change in diagnostic management in 21% of patients when comparing computer analysis versus physician. Moreover, 12% of patients had a change in management when comparing between physicians. Finally, the correlation between symptoms differed in 3% of physician-physician interpretations versus 10% of computer-physician interpretations.
Conclusion: Impedance testing analysis is subject to marked variability between physicians and computer software. As such, unlike the finite score for pH monitoring, impedance is prone to interpretation error leading to differences in diagnosis and symptom correlation. This variability should be taken into consideration by clinicians when evaluating impedance results.

Back to 2014 Annual Meeting Abstracts
|


