|
 |
Back to 2014 Annual Meeting Abstracts
The Value of Drains As a Fistula Mitigation Strategy for Pancreatoduodenectomy: Something for Everyone? Results of a Randomized Prospective Multi-Institutional Study
Matthew T. Mcmillan*1, William E. Fisher2, Jeffrey Drebin1, Stephen W. Behrman3, Mark Bloomston4, Kimberly M. Brown6, Steven J. Hughes10, Katherine a. Morgan9, Vic Velanovich5, Jordan M. Winter7, Nicholas J. Zyromski8, Charles M. Vollmer1
1Surgery, University of Pennsylvania School of Medicine, Philadelphia, PA; 2Surgery, Baylor College of Medicine, Houston, TX; 3Surgery, University of Tennesse Health Science Center, Memphis, TN; 4Surgery, The Ohio State University, Columbus, OH; 5Surgery, University of South Florida, Tampa, FL; 6Surgery, University of Texas Medical Branch, Galveston, TX; 7Surgery, Jefferson Medical College, Philadelphia, PA; 8Surgery, Indiana University, Indianapolis, IN; 9Surgery, Medical University of South Carolina, Charleston, SC; 10Surgery, University of Florida, Gainesville, FL
Introduction: A recent randomized controlled trial investigating intraperitoneal drain use during pancreatoduodenectomy (PD) had a primary goal of assessing overall morbidity. It was terminated early with findings that routine elimination of drains in PD increases mortality and the severity and frequency of overall complications. Here, we provide a subset analysis of drain value in reference to clinically-relevant postoperative pancreatic fistula (CR-POPF), with emphasis on risk-adjusted outcomes.
Methods: Nine institutions performed 137 PDs, with patients randomized to intraperitoneal drainage (D; n=68) or no drainage (ND; n=69). CR-POPFs were categorized, at POD 60, as ISGPF Grade B or C. The Fistula Risk Score (FRS), a 10-point scale derived from four validated risk factors for CR-POPF (soft gland, small duct, high-risk pathology, increased blood loss), facilitated risk adjustment between groups. FRS risk zones include: Negligible (FRS 0), Low (FRS 1-2), Moderate (FRS 3-6) & High (FRS 7-10).
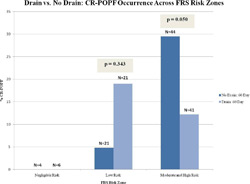
Results: There was no difference in overall fistula risk between the two groups as judged by mean FRS (D=3.51 vs. ND=3.57; p=0.897), rates of each of the aforementioned individual risk factors, or stent use. When used, drains were typically removed POD 7. Overall, CR-POPF rates were higher in the no drain group compared to the drain group (20.3% vs. 13.2%; OR: 1.67; p=0.269), as were rates of the severe Grade C POPFs (8.7% vs. 2.9%; OR: 3.14; p=0.274). The use of drains in the presence of known individual FRS factors was associated with lower CR-POPF rates, particularly for soft glands (11.8% vs. 34.3%; OR: 0.26; p=0.027). For each cohort, CR-POPF occurrence was assessed across the various FRS risk zones. CR-POPF never occurred in the 10 patients with negligible risk. In patients with Low risk, the rate of CR-POPF was actually higher when drains were utilized (19.0% vs. 4.8%; OR: 4.71; p=0.343). Conversely, there were significantly fewer CR-POPFs (12.2% vs. 29.5%; p=0.050) when drains were used in Moderate and High risk scenarios (Figure). The benefit of drains in these particular patients is detailed in Table 1. Lastly, patients who suffered CR-POPFs experienced shorter duration of stay (15.2d vs. 34.7d, p=0.010) and reduced 90-d mortality (11.1% vs. 42.9%; OR: 0.17; p=0.176) when a drain was used.
Conclusion: Controversy exists over the efficacy of drains as a fistula mitigation strategy in cases of PD. The results of this analysis suggest that drains diminish the rate and severity of CR-POPF in patients with Moderate and High fistula risk, but they might be avoided in the roughly one-third of patients with Negligible or Low risk. The premature discontinuation of this study, due to obvious deleterious outcomes in the absence of drains, limits its statistical power; yet, the randomization process and risk adjustment with the FRS ensures absence of bias. Moderate and High Risk Groups (FRS 3-10) | FRS Risk Factors | No Drain (N=44) | Drain (N=41) | p-value | Odds Ratio | | N | CR-POPF, N (%) | N | CR-POPF, N (%) | | Soft Gland Texture | 33 | 12 (36.4) | 32 | 3 (9.4) | 0.010 | 5.52 | | EBL (>400 mL) | 21 | 8 (38.1) | 21 | 3 (14.3) | 0.079 | 3.69 | | Duct Diameter (<5mm) | 35 | 11 (31.4) | 35 | 5 (14.3) | 0.088 | 2.75 | | High-Risk Pathology | 26 | 8 (30.8) | 23 | 3 (13.0) | 0.138 | 2.96 | | | ≥ 1 Risk Factors | 44 | 13 (29.5) | 41 | 5 (12.2) | 0.050 | 3.02 | | ≥ 2 Risk Factors | 42 | 13 (31.0) | 38 | 5 (13.2) | 0.057 | 2.96 | | ≥ 3 Risk Factors | 24 | 10 (41.7) | 26 | 3 (11.5) | 0.015 | 5.46 |

Back to 2014 Annual Meeting Abstracts
|


