|
 |
Back to Annual Meeting Program
Anatomo-Physiology of the Pharyngo-Upper Esophageal Area in Volunteers At the Light of High Resolution Manometry: Defining Normal Values
Luciana C. Silva*1, Fernando a. Herbella1, Luciano R. Neves1, Fernando P. Vicentine1, SebastiãO Pannocchia1, Marco G. Patti2
1UNIFESP, Sao Paulo, Brazil; 2Department of Surgery, University of Chicago, Chicago, IL
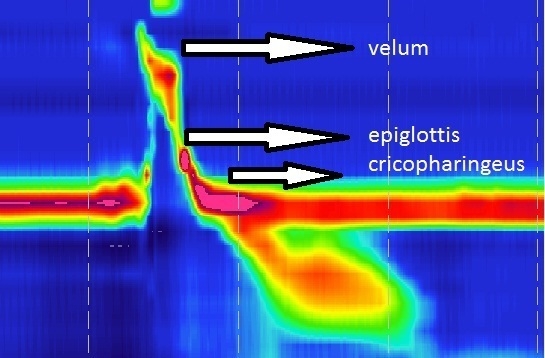
Introduction: High resolution manometry (HRM) is a recent and valuable tool in the assessment of esophageal motility. The experience with this technology in the evaluation of pharyngeal and upper esophageal disorders is still incipient. This study aims to: (a) define normal values for pharyngo-upper esophageal motility, and (b) correlate HRM plots with pharyngeal anatomic landmarks.
Methods: 29 healthy individuals (mean age 30 years, 62% males) underwent HRM with a solid-state catheter with 36 circumferential sensors spaced 1 cm apart positioned to record from the base of the tongue to the esophagus. Pharyngeal, upper esophageal sphincter and proximal esophagus parameters were recorded by giving 10 swallows of 5 mL of water at 30-second intervals. The analysis was performed with the commercial dedicated software. Fourteen individuals also underwent a concomitant transnasal pharyngoscopy.
Results: Manometric parameters are depicted in table 1. The correlation between HRM plots and pharyngeal anatomic landmarks is shown in figure 1.
Conclusion: Normal values for pharyngeal, upper esophageal sphincter and proximal esophagus parameters have been determined. These results may be applied in future studies.
Manometric values
| Pharynx | Upper esophageal sphincter | Proximal esophagus | | Peak pressure at 2 cm above mid UES | 203,8 (160-225,6) | Basal pressure | 88,5 (65,72-119,55) | Amplitude 2 cm below mid UES | 64,3 (51,7-100,4) | | Contraction duration at 2 cm above mid UES | 471 (349-697) | Residual pressure | 4,1 (0,85-7,77) | Amplitude 4 cm below mid UES | 65,7 (45,7-76,5) | | Start at 2 cm above mid UES to UES start | -494 (-541- -419) | Relaxation time to nadir | 198 (169,7-264) | Amplitude 6 cm below mid UES | 35,05 (18,8-47,3) | | Start at 2 cm above mid UES to UES nadir | -235 (-355 - -181) | Ralaxation duration | 698,5 (629,7-773,2) | | | | Start at 2 cm above mid UES to UES end | 212 (183-269) | Recovery duration | 475 (380,2-561,5) | | |
Data presented as median (interquartile range)

Back to Annual Meeting Program
|


